
Fig. 2 |. ETV6 knockout in Ewing sarcoma drives mesenchymal differentiation.
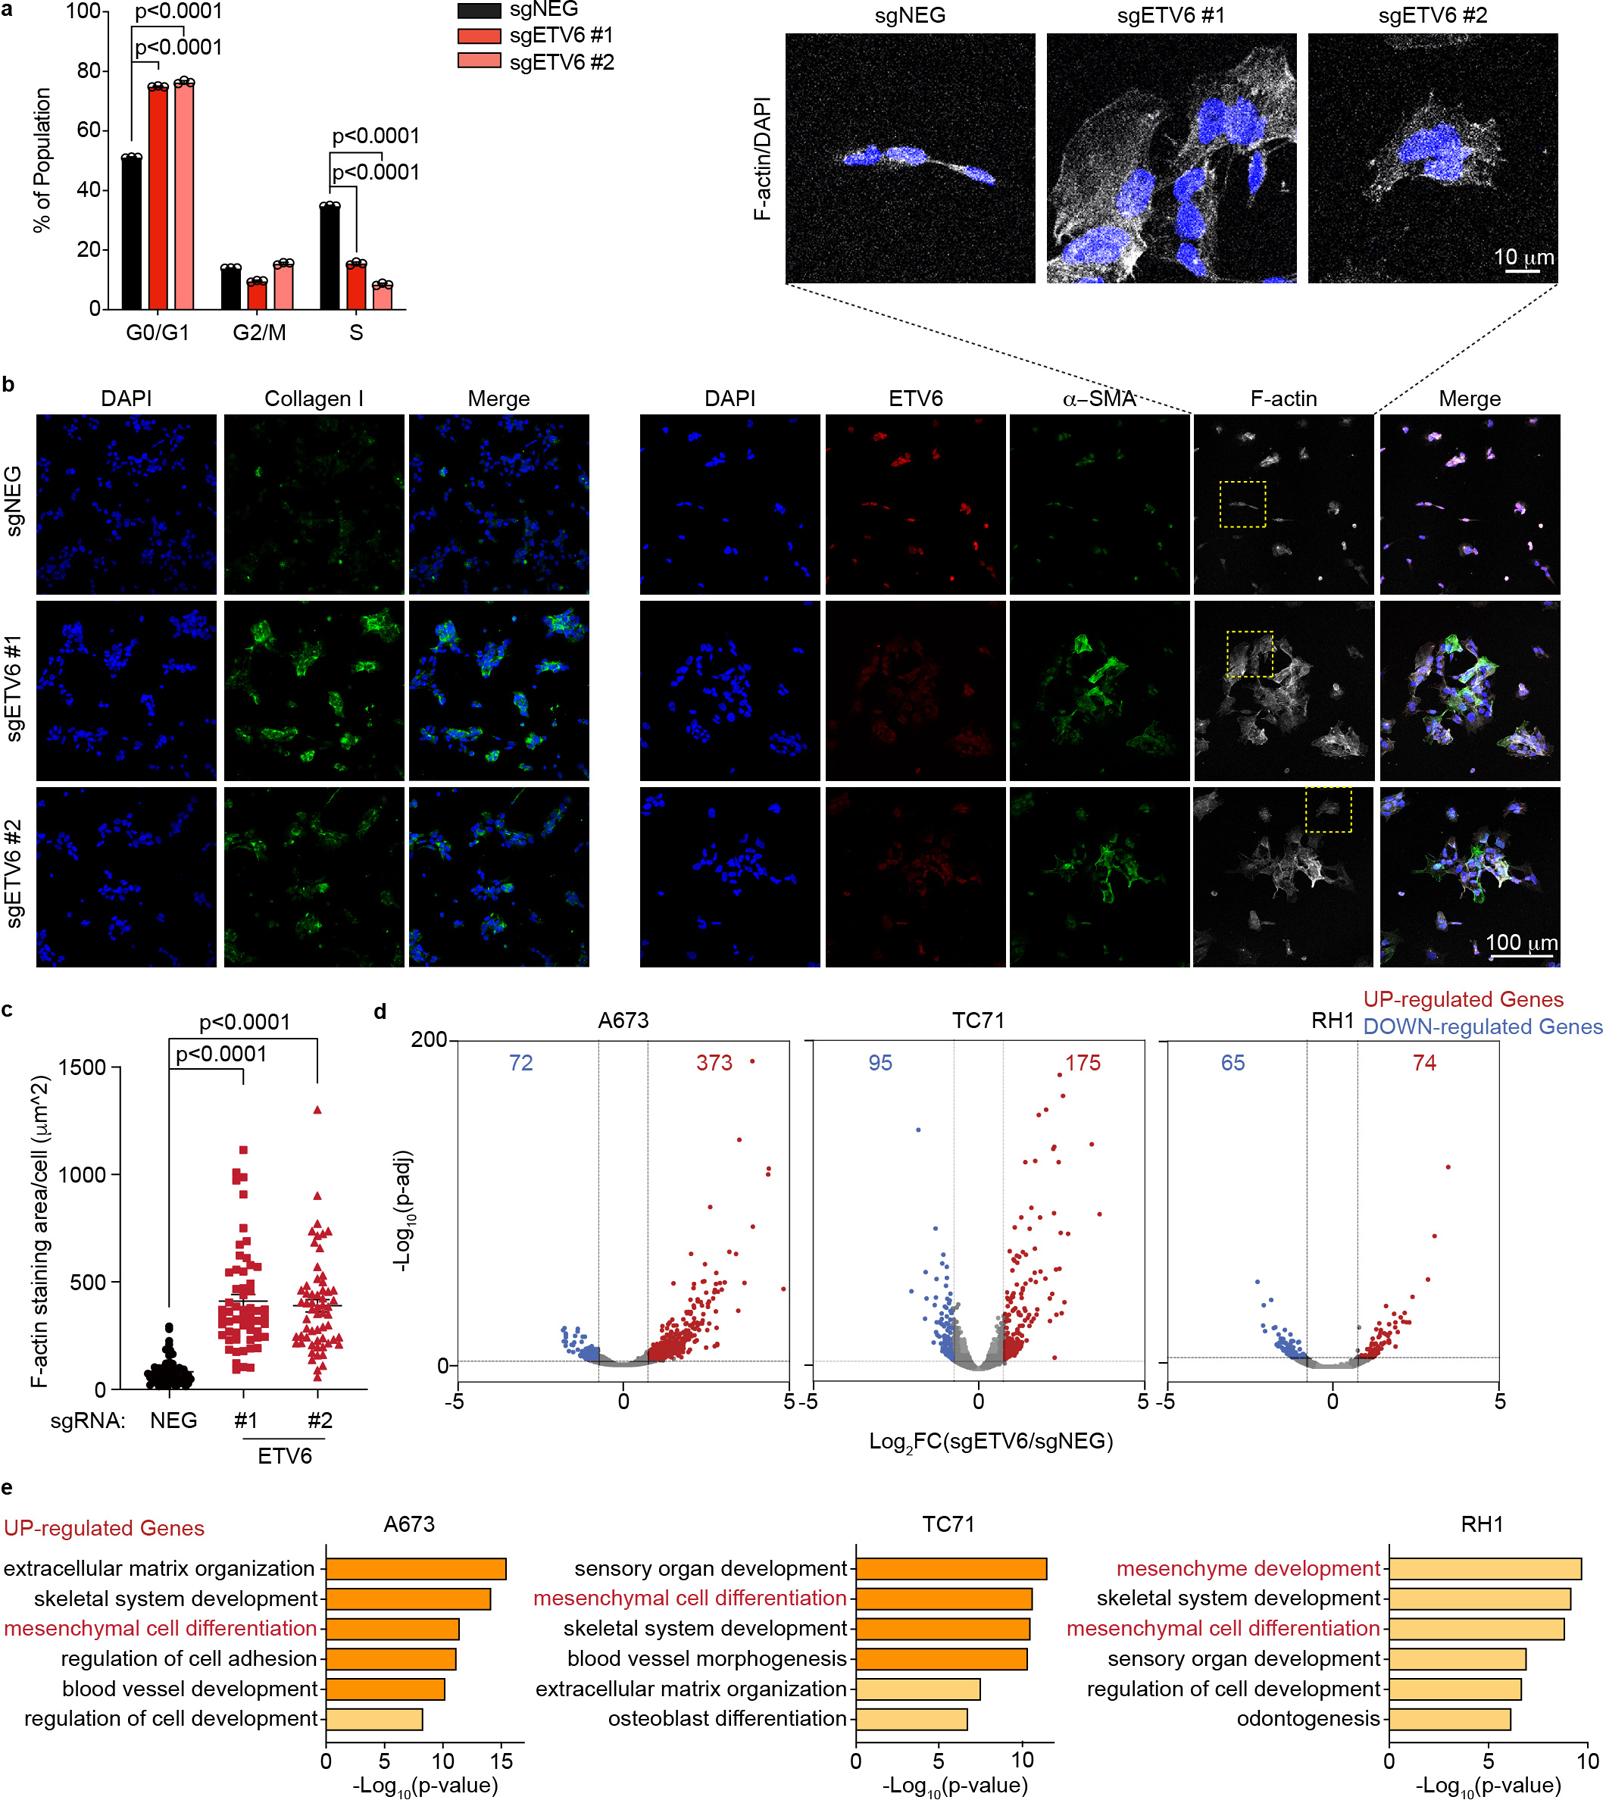
a, Cell cycle analysis based on BrdU incorporation and DNA content (7-AAD) staining of A673 cells infected with indicated sgRNAs. Data are mean ± s.e.m. P values were calculated using one-way ANOVA, Dunnett’s multiple comparison tests (n = 3 biological replicates). b, Representative images of immunofluorescence staining for ETV6 (red), two mesenchymal differentiation markers: collagen I (green, left), α-SMA (green, right) and the cytoskeleton component F-actin (white) in A673 cells infected with indicated sgRNAs. Top: zoomed-in areas of F-actin and DAPI overlay. c, Quantification of cell size based on F-actin staining. The size of F-actin-stained area (μm2 ) per cell was quantified in each group. Data are mean ± s.e.m. P values were calculated using Kruskal– Wallis one-way ANOVA, Dunnett’s multiple comparison tests (sgNEG; n = 65 cells, sgETV6 #1; n = 58 cells; sgETV6 #2; n = 60 cells). d, Volcano plots showing the gene changes upon ETV6 knockout in three different Ewing sarcoma cell lines assessed by RNA-seq. Upregulated genes (log2FC >0.5, adjusted P value