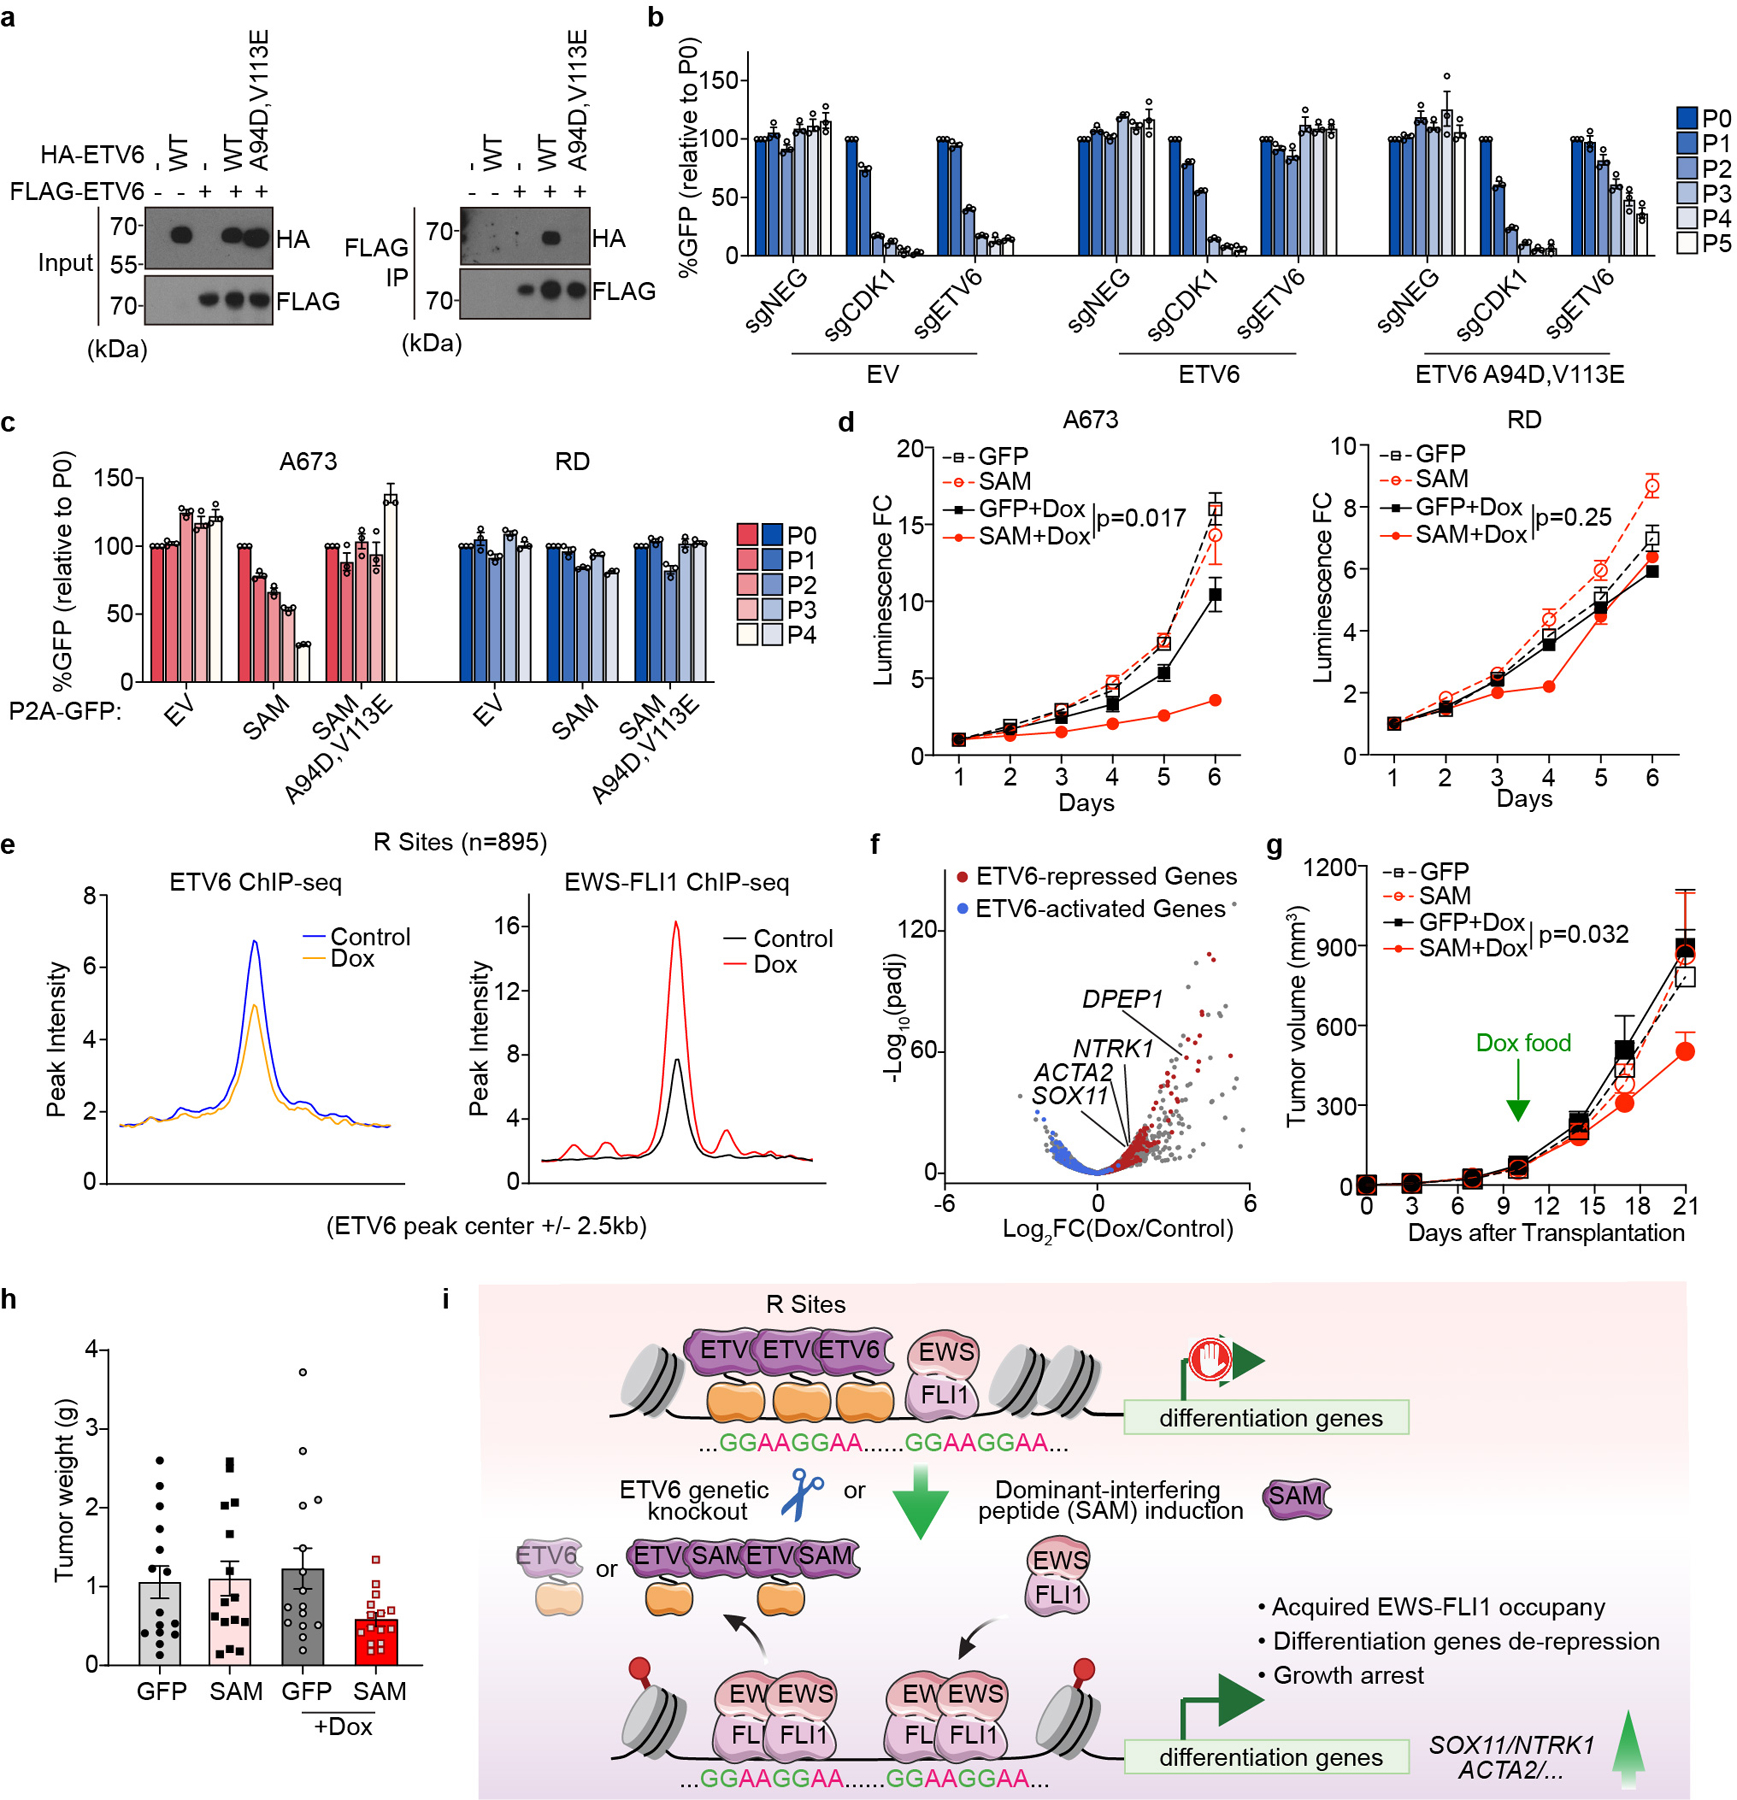
Fig. 6 |. Squelching of ETV6 with a SAM domain reprogrammes EWS-FLI1 occupancy and blocks Ewing sarcoma growth in vivo.

a, Immunoprecipitation assay showing ETV6 (A94D and V113E) mutant is defective for selfoligomerization. b, Competition-based proliferation assay in A673 cells harbouring empty vector, sgRNA-resistant 3× FLAG-tagged wild-type or (A94D and V113E) mutant ETV6 cDNA and infected with a control (sgNEG), CDK1 or ETV6 sgRNA. Data are mean ± s.e.m (n = 3 biological replicates). c, Competition-based proliferation assay evaluating the effects of different ETV6 fragments induction to cell fitness in A673 and RD cells. The expression of FLAG-tagged ETV6 SAM fragment is linked to a GFP reporter. Data are mean ± s.e.m. (n = 3 biological replicates). d, CellTiter-Glo assay evaluating the effects of SAM induction to A673 and RD cell proliferation in vitro. The relative luminescence FCs to day 1 were plotted. Data are mean ± s.e.m. P values were calculated using two-way ANOVA (n = 3 biological replicates). e, Metagene representation of the mean ETV6 and EWS-FLI1 signal changes upon ETV6 SAM induction across R sites. f, Volcano plot showing the gene expression changes upon ETV6 SAM induction in A673 cells. The ETV6 repressed (red) and activated (blue) genes were defined on the basis of the genetic knockout of ETV6 in the same cell line. g, Average growth curves of Dox-inducible GFP- or SAM-expressing A673 xenografts in immunodeficient mice. The mice in Dox groups were put on Dox food on day 10 post injection. Linear mixed-effects model with treatment, time and treatment by time interaction as fixed effects and sample specific random intercept was used to fit the longitudinal tumour volume data. Differences in tumour volume were examined using simultaneous tests for general linear hypotheses of contrasts of interest. Data are mean ± s.e.m. P values were adjusted for multiple comparisons using the Bonferroni–Holm’s method (n = 15 tumours). h, Weights of the resected tumours at the end point. Data are mean ± s.e.m (n = 15 tumours). i, Model of EWS-FLI1 imposed ETV6 dependency in Ewing sarcoma.
