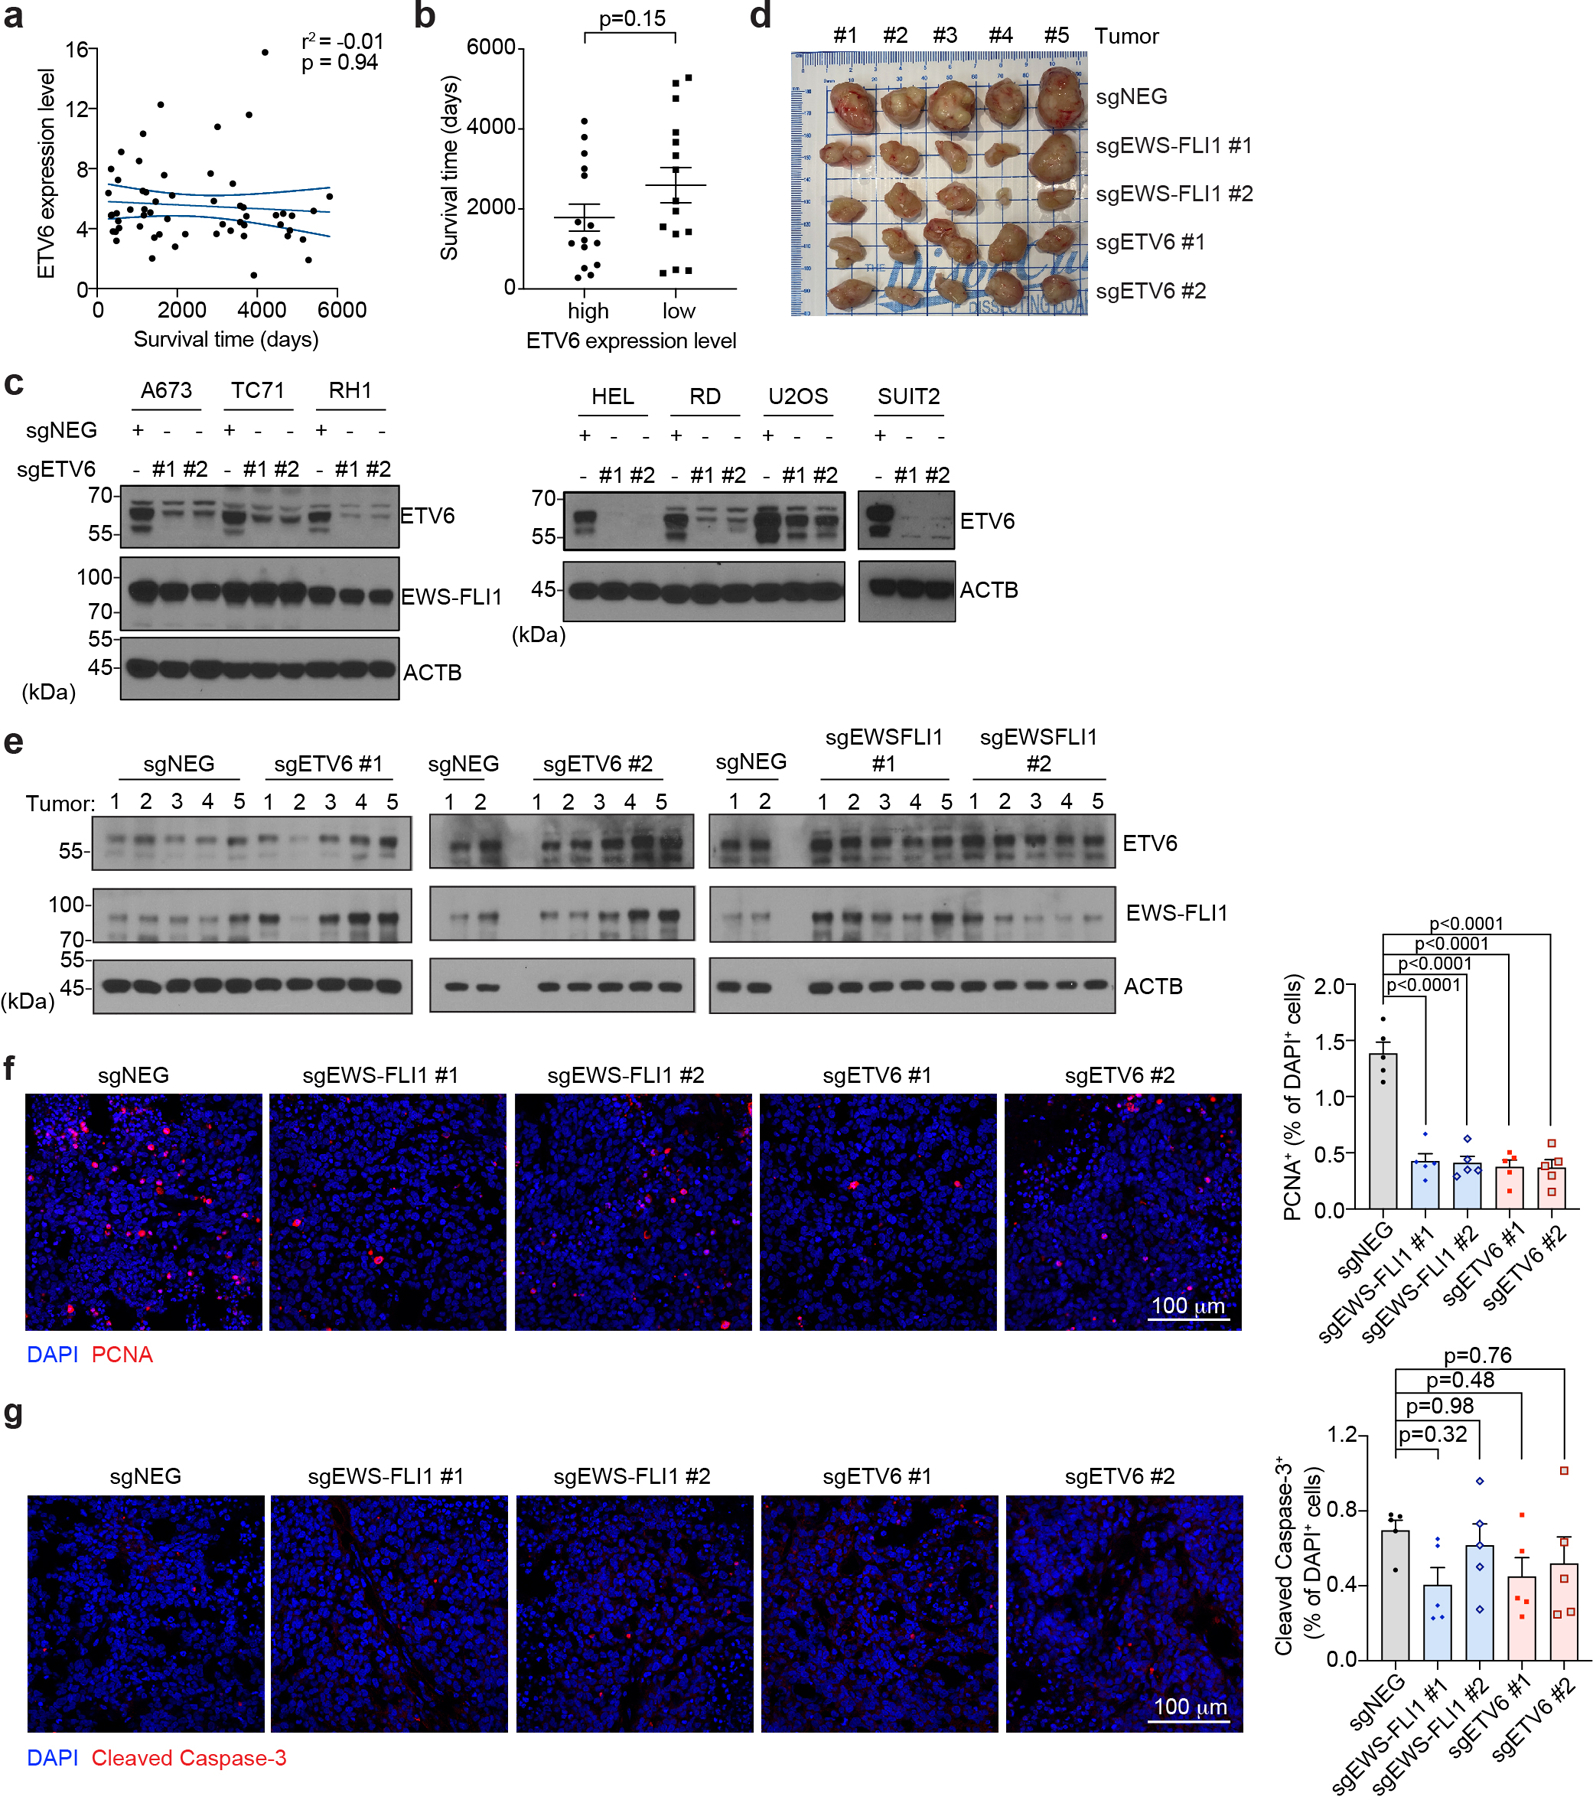
Extended Data Fig. 1 |. ETV6 is a dependency in Ewing sarcoma cell lines.

(a) Scatterplot showing the correlation between patient survival time and ETV6 expression level in primary tumours from the ICGC BOCA-FR dataset containing 57 Ewing sarcoma patients. Blue lines mark the mean with 95% confidence interval. (b) Comparison of patient survival time between ETV6-high (Top 25%, n = 15) and ETV6-low patients (Bottom 25%, n = 15). Data are mean ± SEM. P value was calculated using two-tailed unpaired Student’s t-test. (c) Western blot of ETV6 and EWS-FLI1 levels confirming the knockout of ETV6 in different cancer cell lines. Beta-ACTIN (ACTB) was used as a loading control. (d) Photographs of collected tumours at end time point. (e) Western blot indicates that the resulting tumours from A673 xenograft experiments maintain similar levels of ETV6 and EWS-FLI1. ACTB was used as a loading control. (f) Representative images of immunofluorescence staining for PCNA (red) in the resulting tumours from A673 xenograft experiments (left panel). Percentage of PCNA-positive over DAPIpositive cells was quantified in the right panel. Data are mean ± SEM. P values were calculated using one-way ANOVA, Tukey’s multiple comparison tests. (n = 5 tumours) (g) Representative images of immunofluorescence staining for Cleaved Caspase-3 (red) in the resulting tumours from A673 xenografts (left panel). Percentage of Cleaved Caspase-3 positive over DAPI stained cells was quantified in the right panel. Data are mean ± SEM. P values were calculated using one-way ANOVA, Tukey’s multiple comparison tests. (n = 5 tumours).
