
Extended Data Fig. 2 |. ETV6 knockout in Ewing sarcoma drives mesenchymal differentiation.
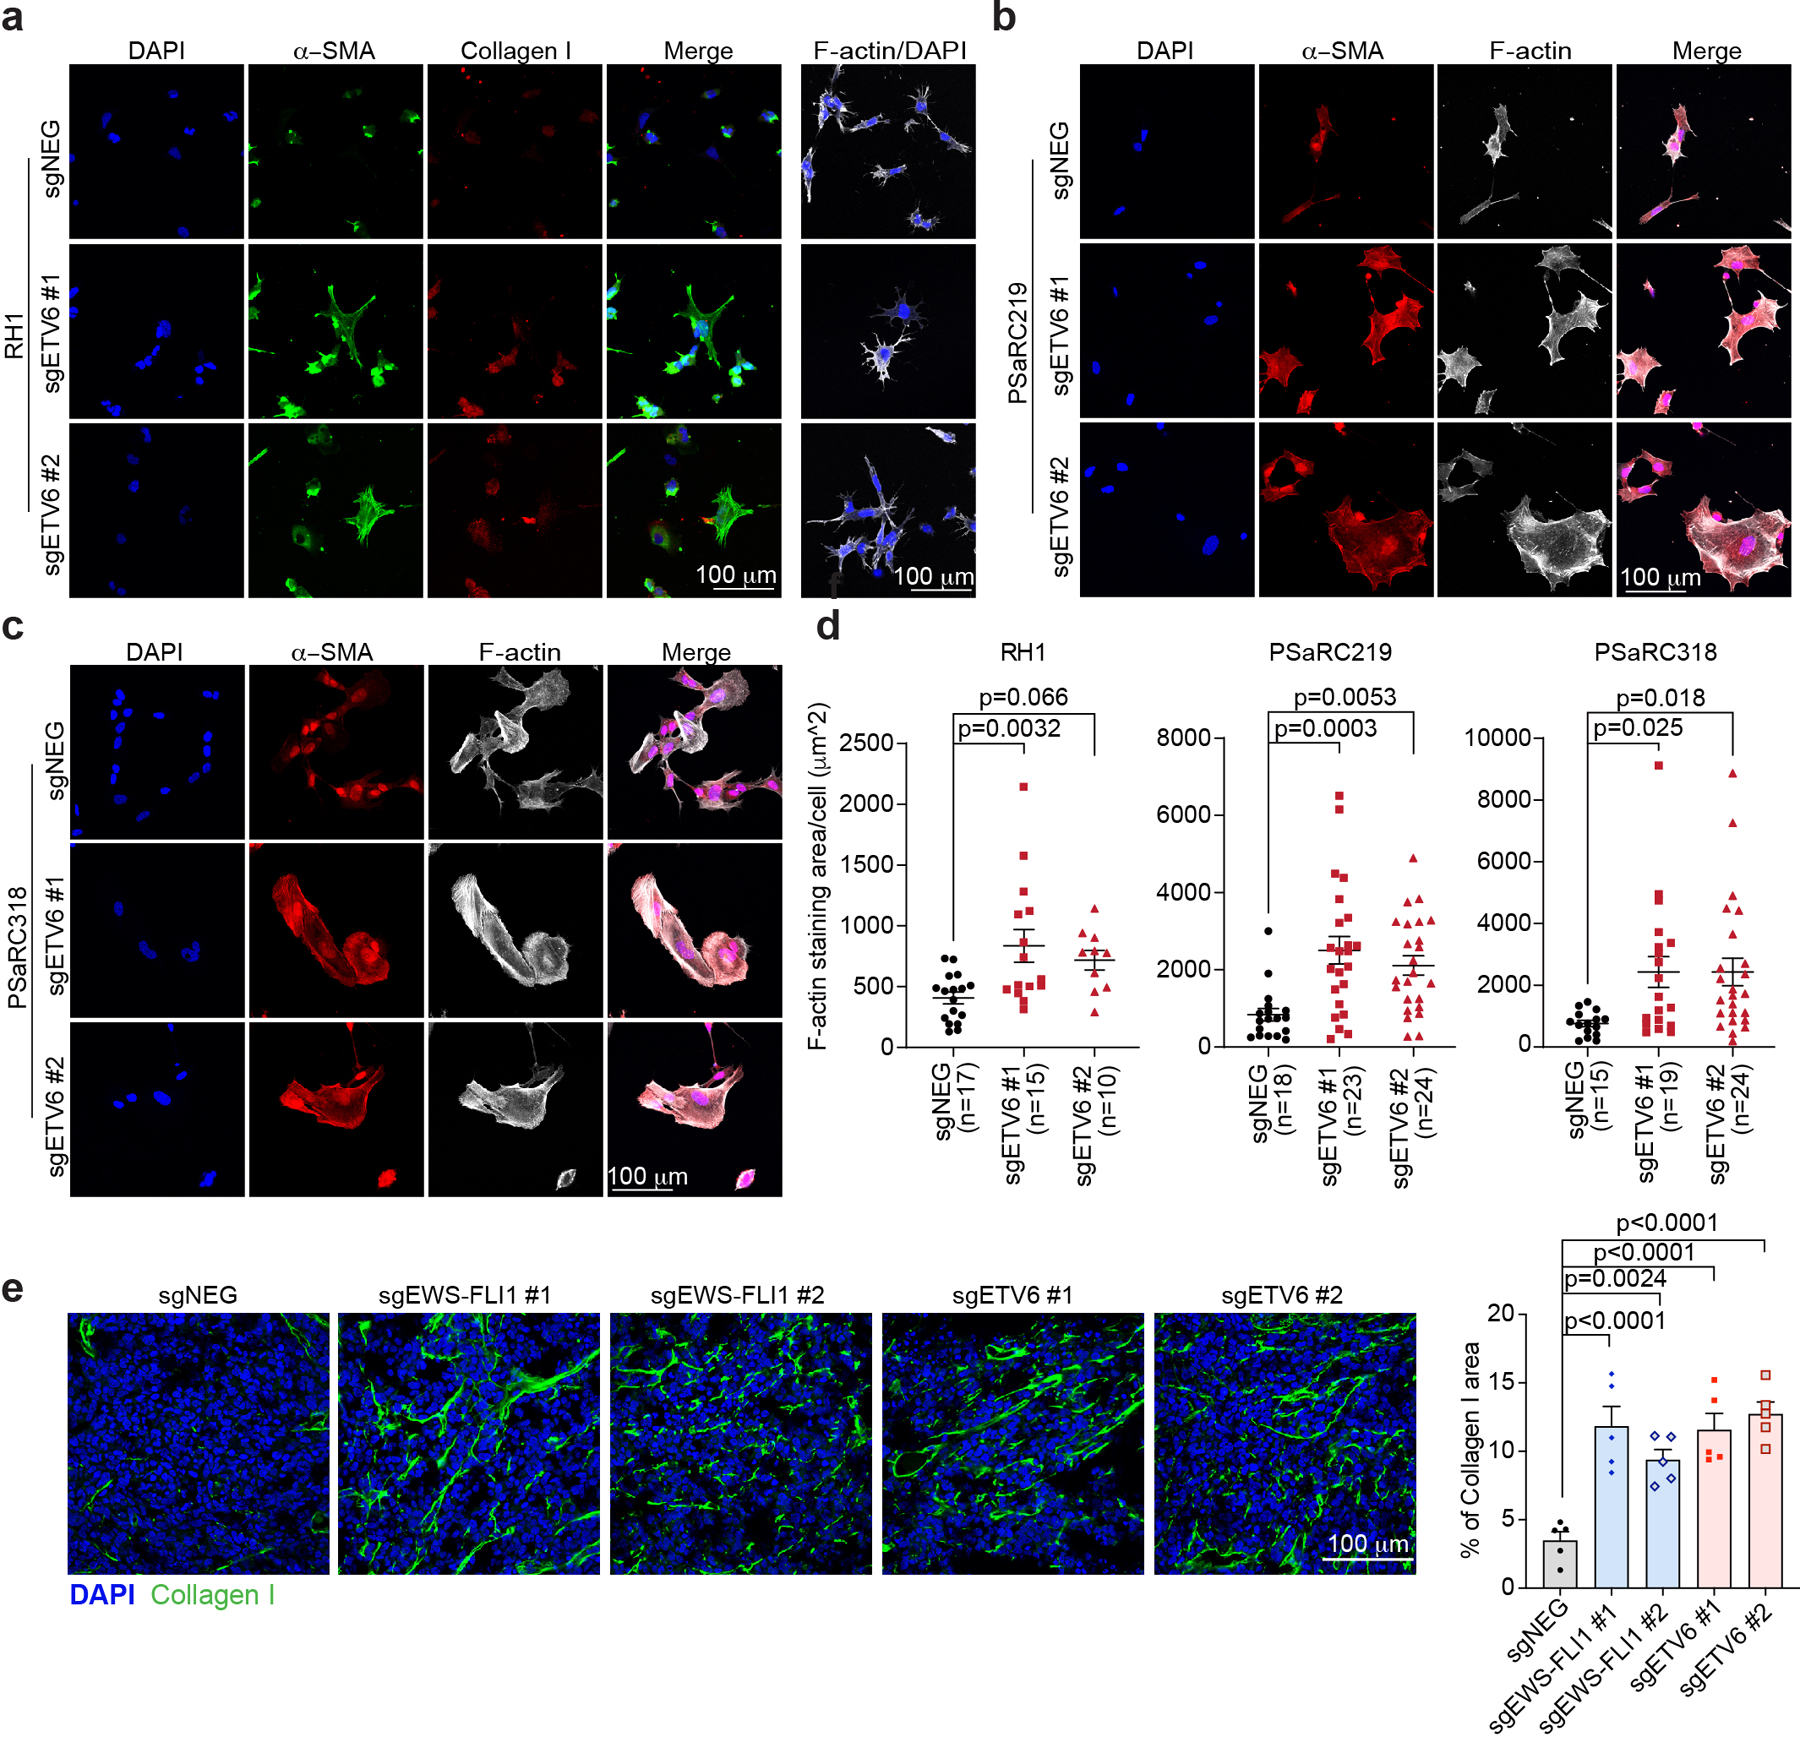
(a) Representative images of immunofluorescence staining for collagen I (red), alpha smooth muscle actin (α-SMA, green) and the cytoskeleton component F-actin (white) in RH1 cells infected with indicated sgRNAs. (b, c) Representative images of immunofluorescence staining for alpha smooth muscle actin (α-SMA, red) and the cytoskeleton component F-actin (white) in two independent patient-derived Ewing sarcoma tumour cells PSaRC219 (b) and PSaRC318 (c) infected with indicated sgRNAs. (d) Quantification of cell size based on F-actin staining (μm2 ) in RH1, PSaRC219 and PSaRC318 cells. Data are mean ± SEM. P values were calculated using one-way ANOVA, Dunnett’s multiple comparison tests. (e) Representative images of immunofluorescence staining for collagen I (green) in the resulting tumours from A673 xenografts (left). Percentage of Collagen I stained area was quantified (right). (n = 5 tumours) Data are mean ± SEM. P values were calculated using one-way ANOVA, Dunnett’s multiple comparison tests