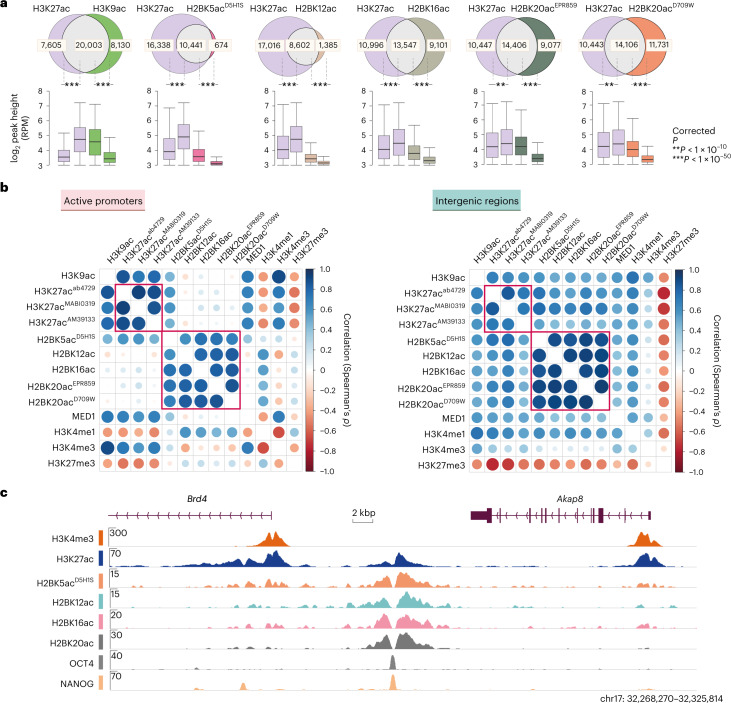
Fig. 1. Most H2BNTac site peaks overlap with H3K27ac.
a, Venn diagrams showing the overlap between the number of ChIP–seq peaks identified for the indicated histone acetylation marks. The box plots below each Venn diagram show the ChIP signal intensity of the overlapping and nonoverlapping peaks. One H2BNTac peak can overlap with more than one H3K27ac peak or vice versa, which leads to slight differences in the total number of H3K27ac peak counts in the different Venn diagrams. The box plots display the median, upper and lower quartiles; the whiskers show the 1.5× interquartile range (IQR). Number of ChIP–seq biological replicates: H2BK5acD5H1S (n = 4); H3K27ac (n = 3); H2BK12ac (n = 2); H2BK16ac (n = 2); H2BK20acEPR859 (n = 2); H2BK20acD709W (n = 1) and H3K9ac (n = 1). Two-sided Mann–Whitney U-test, adjusted for multiple comparisons with the Benjamini–Hochberg method; **P < 1 × 10⁻¹⁰, ***P < 1 × 10−50. b, Correlation among H2BNTac sites and the other indicated chromatin marks. Pairwise correlation (Spearman’s ρ) was determined using the normalized ChIP–seq counts, using the universe of all peaks. Left, correlation at the active promoter regions (±1 kb from the TSS). Right, correlations at intergenic regions. Color intensities and the size of the circles indicate correlation (Spearman’s ρ). c, Representative genome browser tracks showing differential occupancy of H3K27ac and the indicated H2BNTac marks.

