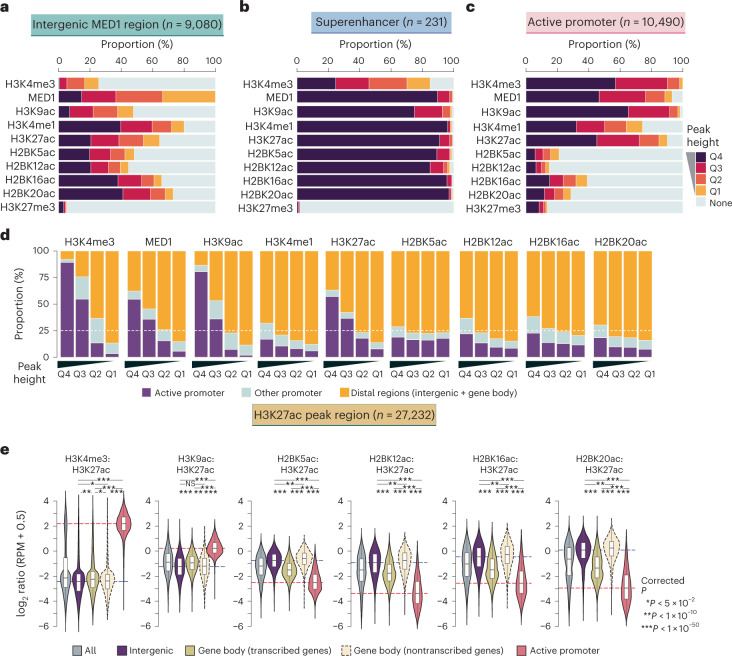
Fig. 2. H2BNTac prominently marks enhancers and discriminates them from active promoters.
a–c, Fraction of the indicated chromatin mark peaks mapping to MED1-occupied intergenic regions (a), MED1-occupied superenhancers (b) and active promoters (c). Based on peak height, the indicated chromatin marks are grouped into quartiles (Q4–Q1). Active promoters (±1 kb from the TSS) are defined as those mapping to genes expressed in mESCs (5-ethynyluridine (EU) RNA sequencing (RNA-seq) transcripts per million (TPM) ≥ 2) and marked with H3K4me3. d, Fraction of the indicated chromatin marks mapping to the specified genomic regions. For each chromatin mark, peaks were grouped into quartiles (Q4–Q1); in each category, the fraction of peaks mapping to the indicated genomic regions is shown. Active promoters are defined as in a and the remaining gene TSS are classified as other promoters. e, The H2BNTac signal is higher in distal candidate enhancers than in active promoters. Shown are the relative ChIP signal intensities of the H3K27ac and H2BNTac sites in H3K27ac-occupied regions. H3K27ac peak regions are grouped into the following categories: all, all peaks; intergenic, peaks occurring outside promoters and gene bodies; gene body (transcribed genes, TPM ≥ 2); peaks occurring within actively transcribed gene bodies; gene body (nontranscribed genes); peaks occurring within the nontranscribed gene body. Active promoters were defined as in a. The dotted lines indicate the median ratio at intergenic and active promoter regions. The box plots display the median, upper and lower quartiles; the whiskers show 1.5× IQR. Two-sided Mann–Whitney U-test, adjusted for multiple comparisons using the Benjamini–Hochberg method; NS, not significant, P ≥ 0.05, *P < 0.05, **P < 1 × 10⁻¹⁰, ***P < 1 × 10−50.

