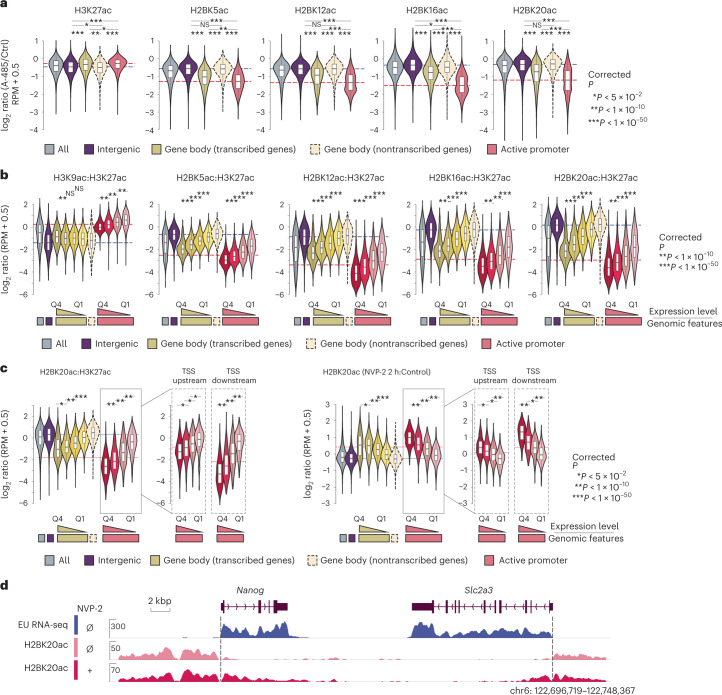
Fig. 3. CBP/p300 regulates global H2BNTac and the H2BNTac signal is lower in actively transcribed regions.
a, Relative ratio of H3K27ac and H2BNTac site ChIP signal intensity in untreated and A-485-treated (15 min) cells. Different genomic regions were classified as defined in Fig. 2e. The dotted lines indicate the median ratio at intergenic and active promoter regions. b, Ratio of the indicated histone marks in H3K27ac-marked regions. Based on the nascent transcription levels, the corresponding genes, gene body and active promoter regions were further subdivided into quartiles. c, Shown are the relative ratio of H2BK20ac:H3K27ac in untreated conditions (left) and the relative change in H2BK20ac in NVP-2-treated and untreated cells (right). H2BK20ac was analyzed in untreated and NVP-2-treated (2 h) cells using ChIP–seq (n = 1). Different genomic regions were classified as defined in Fig. 2e. Based on the nascent transcription levels, the corresponding genes, gene body and active promoter regions were further subdivided into quartiles. Moreover, in active promoters, TSS upstream (0 ± 2 kb from the TSS) and TSS downstream (0 ± 2 kb from TSS) regions were analyzed separately. d, Representative genome browser tracks showing the differential increase in H2BK20ac in intergenic and transcribed gene body regions. The box plots display the median, upper and lower quartiles; the whiskers show the 1.5× IQR. Two-sided Mann–Whitney U-test, adjusted for multiple comparisons using the Benjamini–Hochberg method; *P < 0.05, **P < 1 × 10⁻¹⁰, ***P < 1 × 10−50.

