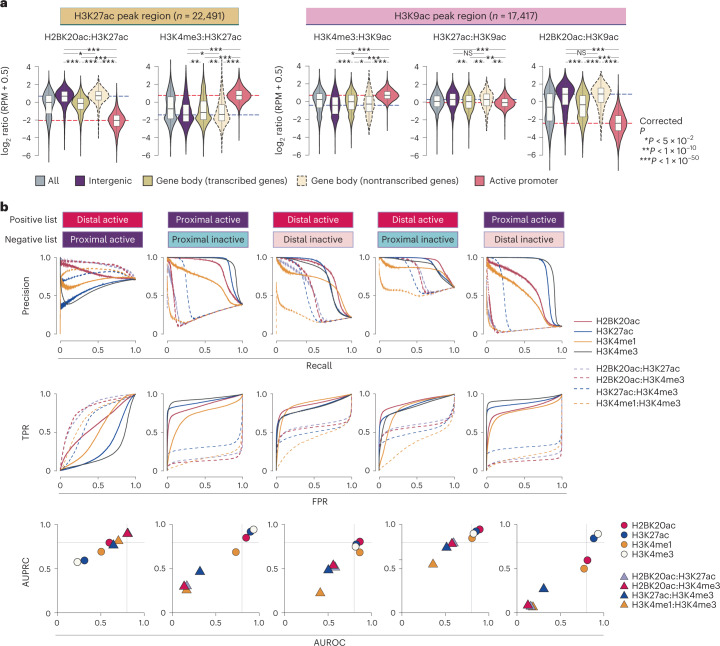
Fig. 4. H2BNTac segregates enhancers and active gene promoters in human cells.
a, Relative ChIP–seq signal intensities of the indicated histone marks at the H3K27ac+ (left) or H3K9ac+ (right) peak regions. The H3K27ac and H3K9ac peak regions were further grouped into the indicated categories, as specified in Fig. 2e. Active promoters are defined as TSS-proximal regions (±1 kb from the TSS) of actively transcribed (RNA-seq, TPM ≥ 2) genes in K562 cells and whose promoters are marked with H3K4me3. Number of ChIP–seq biological replicates: H3K4me3 (n = 2); H2BK20ac (n = 2); H3K9ac (n = 2); H3K27ac (n = 1). The box plots display the median, upper and lower quartiles; the whiskers show the 1.5× IQR. Two-sided Mann–Whitney U-test, adjusted for multiple comparisons using the Benjamini–Hochberg method; *P < 0.05, **P < 1 × 10⁻¹⁰, ***P < 1 × 10−50. b, Combination of H2BNTac and other histone marks discriminate transcriptionally active and inactive PINTS regions. Transcriptionally active and inactive regions in K562 cells were defined based on RNA expression evidence in K562 and non-K562 cell lines14. PINTS regions were further classified as proximal or distal as defined by Yao et al.14 (Methods). The discriminatory potential of different histone marks was analyzed by comparing ChIP–seq signal enrichment within ±500 bp of PINTS region centers. The true positive rate (TPR) and false positive rate (FPR), and AUPRC and AUROC are shown. The curves were generated under the different thresholds of peak enrichment or peak enrichment ratios.

