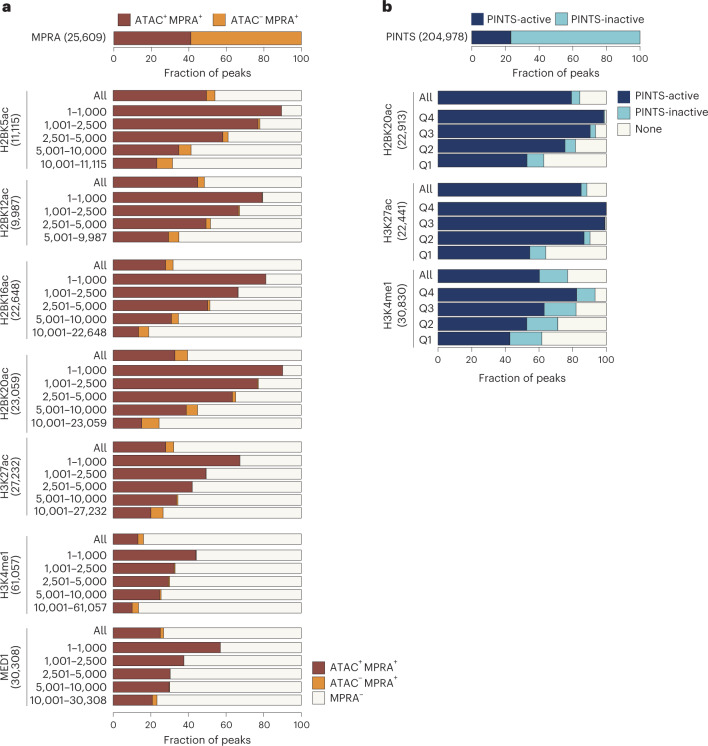
Fig. 5. H2BNTac+ regions show a high validation rate in orthogonal assays.
a, Validation of enhancer activity of H2BNTac+ regions by MPRA. Shown are the fraction of H2BNTac, H3K27ac, H3K4me1 and MED1 regions overlapping with ATAC+MPRA+ or ATAC−MPRA+ regions in mESCs. The top bar chart shows the fraction of MPRA peaks with or without the ATAC signal. The lower bar charts show the fraction of the indicated chromatin mark ChIP–seq peaks that overlap with the ATAC+MPRA+ and ATAC−MPRA+ regions. The indicated chromatin marks were ranked based on peak height and grouped into the indicated rank categories; the overlap with MPRA regions is shown within each rank category and for all peaks (All). b, Most H2BNTac+ regions are actively transcribed in vivo. PINTS-active regions refer to regions that are actively transcribed in K562 cells; PINTS-inactive regions refer to regions that are not transcribed in K562 cells but transcribed in other human cells and tissues14 (Methods). The top bar chart shows the fraction of PINTS regions that are active or inactive in K562 cells. The lower bar charts show the fraction of the indicated chromatin mark ChIP–seq peaks that overlap with PINTS-active and PINTS-inactive regions. None, no PINTS classification was available for these regions.

