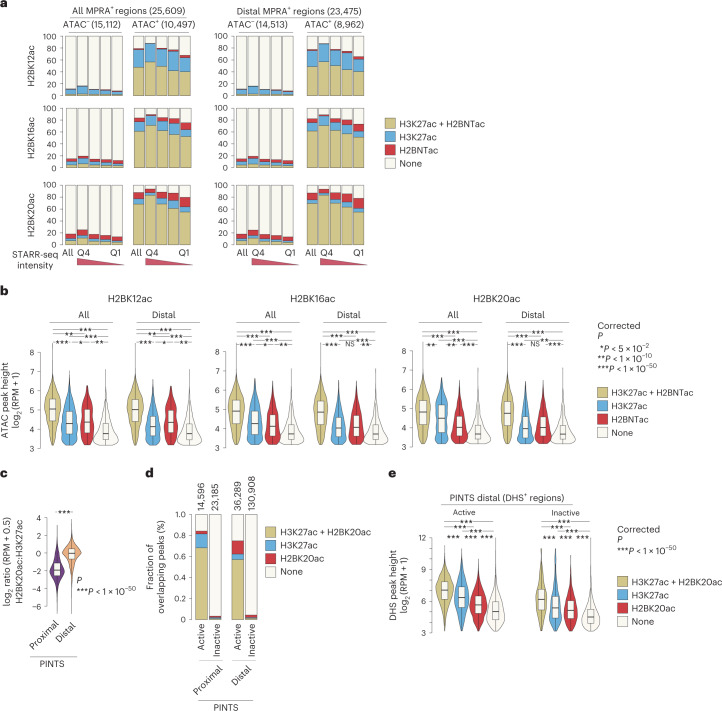
Fig. 6. The most active enhancer regions are marked by H2BNTac and H3K27ac.
a, Most ATAC+MPRA+ regions are marked by H2BNTac or H3K27ac. MPRA regions were grouped into ATAC+ and ATAC−. Within each group, MPRA+ regions were subgrouped into quartiles based on the self-transcribing active regulatory region sequencing (STARR-seq) signal. Shown is the overlap of H2BNTac or H3K27ac in the indicated groups of MPRA regions. All, all MPRA+ regions; distal MPRA+ regions, MPRA+ regions mapping more than ±1 kb away from annotated TSS regions. b, H2BNTac or H3K27ac nonoverlapping MPRA+ regions have low DNA accessibility. MPRA+ATAC+ regions were grouped based on the overlap of the indicated histone acetylation marks; within each group, ATAC peak height was analyzed. MPRA+ATAC+ regions overlapping with the histone marks have much higher accessibility than regions lacking these marks. c, The relative H2BK20ac abundance of H2BK20ac is higher in distal PINTS regions. Shown is the ratio of H2BK20ac:H3K27ac ChIP–seq signal in proximal and distal PINTS regions in K562 cells. d, PINTS regions were grouped into proximal and distal, and further subgrouped into active and inactive (Methods). Shown is the fraction of PINTS regions overlapping with H2BK20ac or H3K27ac in K562 cells. e, Distal PINTS-active regions were grouped based on the occurrence of the indicated histone marks. Within each category, DHS peak height was determined. Distal PINTS-active regions marked with H2BK20ac or H3K27ac have much higher accessibility than regions lacking these marks. The box plots display the median, upper and lower quartiles; the whiskers show 1.5× IQR. Two-sided Mann–Whitney U-test, adjusted for multiple comparisons using the Benjamini–Hochberg method; *P < 0.05, **P < 1 × 10⁻¹⁰, ***P < 1 × 10−50.

