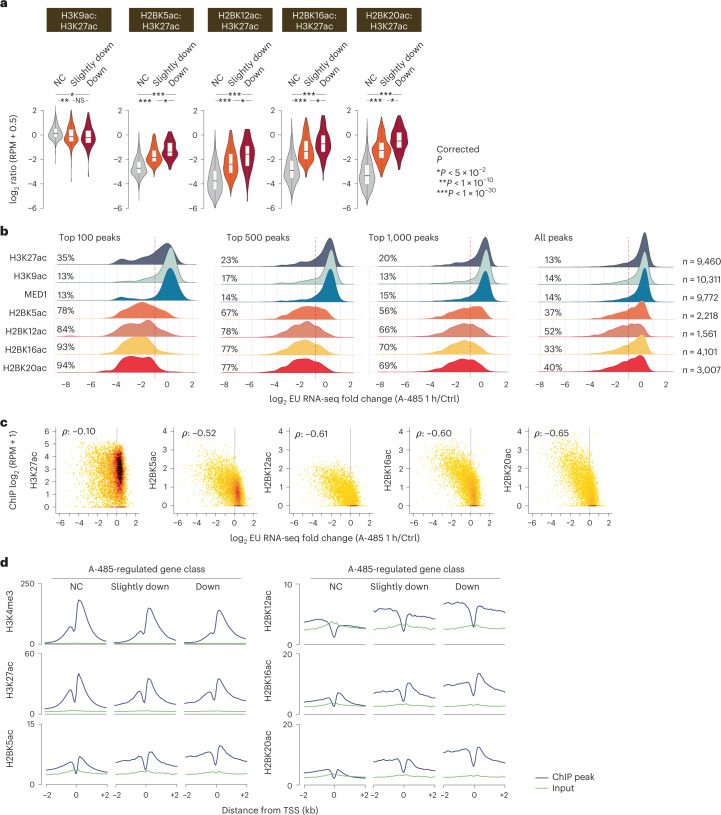
Fig. 7. H2BNTac marks cell type-specific promoters and predicts CBP/p300 target genes in mESCs.
a, Ratio of H2BNTac sites and H3K27ac in the promoters of the indicated CBP/p300-regulated gene categories. mESC genes were grouped into A-485-downregulated (Down), slightly downregulated or not changed (NC) categories, as defined by Narita et al.21 (EU RNA-seq: n = 5 biological replicates). The ratio of the indicated histone marks was determined by normalized ChIP–seq counts in promoters (within ±1 kb of the TSS) of the respective gene categories. The box plots display the median, upper and lower quartiles; the whiskers show the 1.5× IQR. Two-sided Mann–Whitney U-test, adjusted for multiple comparisons using the Benjamini–Hochberg method; *P < 0.05, **P < 1 × 10⁻¹⁰, ***P < 1 × 10−50. b, Genes expressed in mESCs were ranked based on the ChIP–seq signal of the indicated marks in promoter regions (within ±1 kb of the TSS). Shown are the composite nascent RNA transcription profiles for all genes, as well as the top 100, 500 and 1,000 genes with the highest abundance of the indicated mark. Within each group, the fraction of A-485-downregulated genes is indicated. Change in nascent transcription was determined by EU RNA-seq in mESCs treated without or with A-485 (1 h)21. The dotted lines indicate a twofold downregulation of nascent transcription after A-485 treatment. c, Correlation between the ChIP–seq signal of the indicated chromatin marks in promoter regions and A-485-induced nascent transcription changes in mESCs (Spearman’s ρ). d, Aggregate plots showing the average ChIP signal of the indicated marks in the specified classes of A-485-regulated gene promoters in mESCs. A-485-regulated genes21 are classified as follows: NC, transcription decreased by less than 1.2-fold after A-485 treatment; slightly downregulated (transcription decreased by ≥1.5-fold after A-485 treatment); downregulated (transcription decreased by twofold or greater after A-485 treatment).

