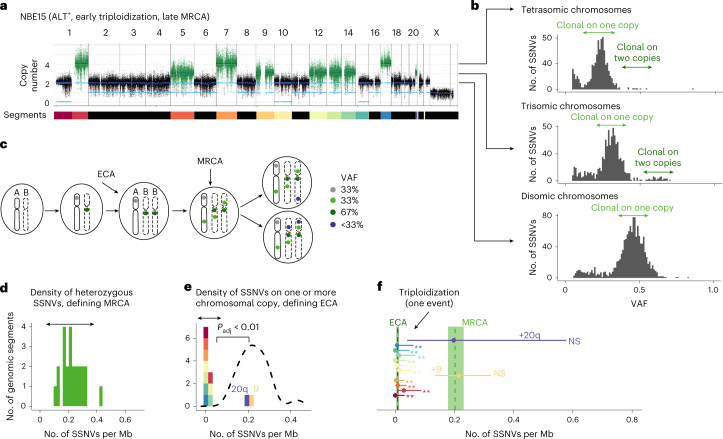
Fig. 2. Timing of chromosomal gains using SSNVs.
a, Copy number profile of a near-triploid tumor with ALT. Each segment of equal copy number is denoteded by a color in the bar at the bottom; these colors are used below to mark the segments in e,f. b, VAF distribution of SSNVs stratified by copy number for the tumor shown in a. c, Schematic introducing the nomenclature based on VAF of SSNVs. d,e, Densities of non-amplified (d) and amplified (e) clonal mutations on genomic segments of length ≥107 bp for the tumor shown in a. e, Dashed line indicates kernel-density estimate of the distribution of non-amplified clonal mutations shown in d. d,e, Chromosomal segments of equal copy number were combined into single genomic segments, and Holm-corrected, one-sided P values were computed based on negative binomial distribution (exact P values provided in Source Data). f, Mutation densities of ECA and MRCA, with 95% confidence bounds estimated by bootstrapping for the tumor shown in a. Horizontal lines represent mutation densities at gained segments, as in e, with 95% confidence bounds computed from χ2 distributions. Segments on which densities of amplified clonal mutations were significantly different from that at MRCA are marked by ** (adjusted P < 0.01); NS, not significant; test and P values as in e. e,f, Color coding for segments is in a.

