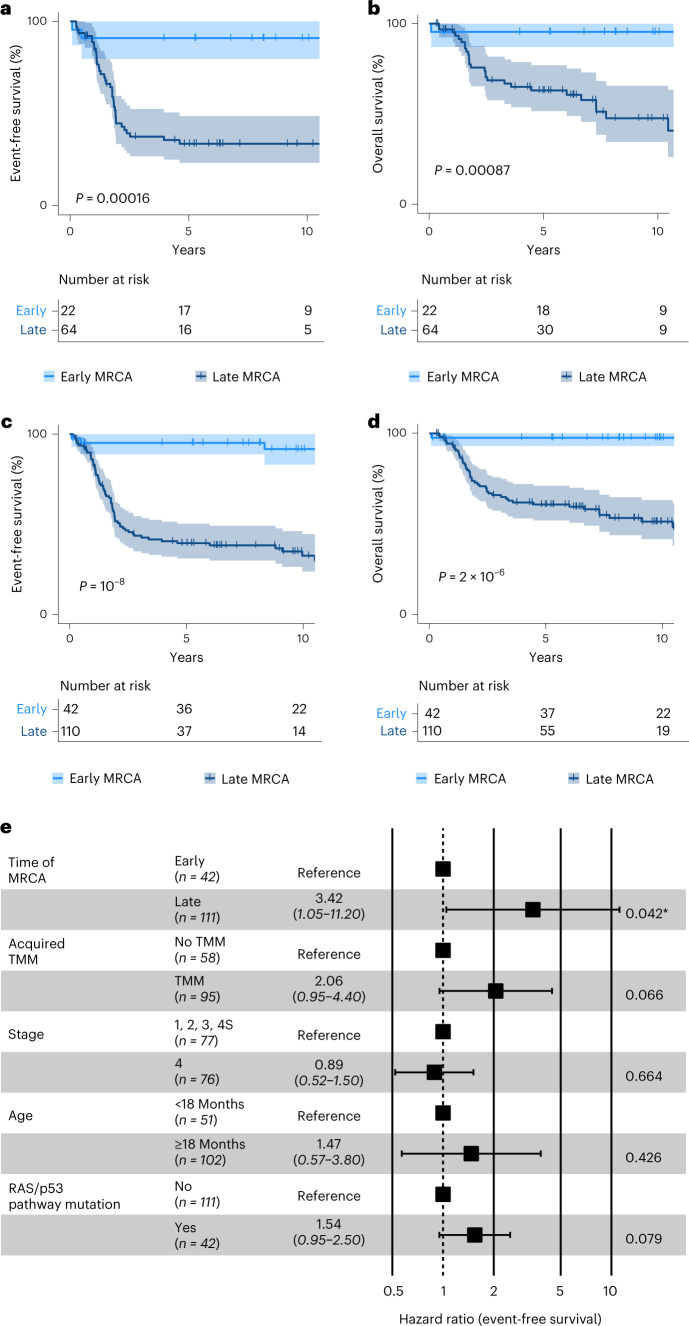
Fig. 5. Survival analysis.
a–d, Event-free (a,c) and overall survival (b,d) stratified by mutation density at the MRCA of primary tumors and metastases from the validation cohort (a,b, n = 86) and from both cohorts (c,d, n = 152). Survival is shown for up to 10 years; P values were computed using the log-rank test, and error band represents 95% confidence interval. e, Multivariate Cox regression analysis for event-free survival of both cohorts (n = 152), considering mutation densities at MRCA, acquired mechanisms of telomere maintenance, disease stage at diagnosis, age at diagnosis and functional mutations in the RAS/p53 pathway. Shown are mean hazard ratio, 95% confidence intervals and P values for each variable (two-sided Wald test; *, P < 0.05).

