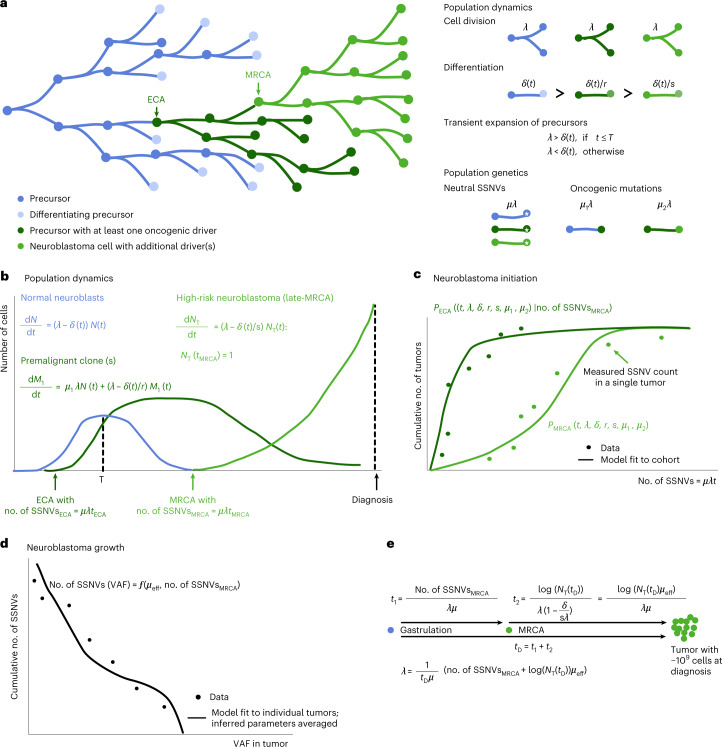
Fig. 7. Population genetics models of tumor initiation and growth.
a, Model scheme. Neuronal precursors divide and differentiate. Oncogenic events at ECA and MRCA cause the outgrowth of premalignant (ECA) and malignant (MRCA) clones. Cells divide at rate λ and differentiate at rate δ; oncogenic mutations reduce the loss rate by a factor 1/r (first event) and 1/s (second event). Neutral SSNVs are acquired at rate μλ in each cell while driver mutations are acquired at lower rates μ1λ (corresponding to the first oncogenic event and defining the ECA of the tumor) and μ2λ (corresponding to the second oncogenic event and defining the MRCA of the tumor). b, Population dynamics of normal neuroblasts (N), premalignant clones (harboring one oncogenic event, M1) and high-risk neuroblastomas (harboring two oncogenic events, NT). Rates are defined in a. c, The model outlined in a,b yields a probability distribution for the time point at which the MRCA emerges (PMRCA(t)); likewise, it also yields a conditional probability for the time point at which the ECA emerged, given the mutation density in the MRCA (PECA(t|no. of SSNVsMRCA)). The parameters of both probability distributions can be estimated from the measured SSNV counts at ECA and MRCA across the cohort. d, Model of mutation accumulation during neuroblastoma growth. Neutral SSNVs are continuously acquired at rate µeff, defined as the number of neutral mutations per effective division (where one effective division produces two surviving daughter cells). By fitting the model to the measured VAF distribution, an estimate for µeff is obtained on the level of individual tumors (subsetting on cases with sufficient data quality and excluding tumors with evidence for subclonal selection during tumor growth). e, Estimation of division rate in actual time. The time between gastrulation and diagnosis (tD) consists of a premalignant time span, up to the emergence of the MRCA (t1), and the expansion of the tumor thereafter (t2). Assuming exponential tumor growth and approximately 109 tumor cells at diagnosis, this yields an estimate for the division rate per tumor for the subset used to estimate µeff. To obtain an estimate for the population level, these estimates are subsequently averaged across the cohort.

