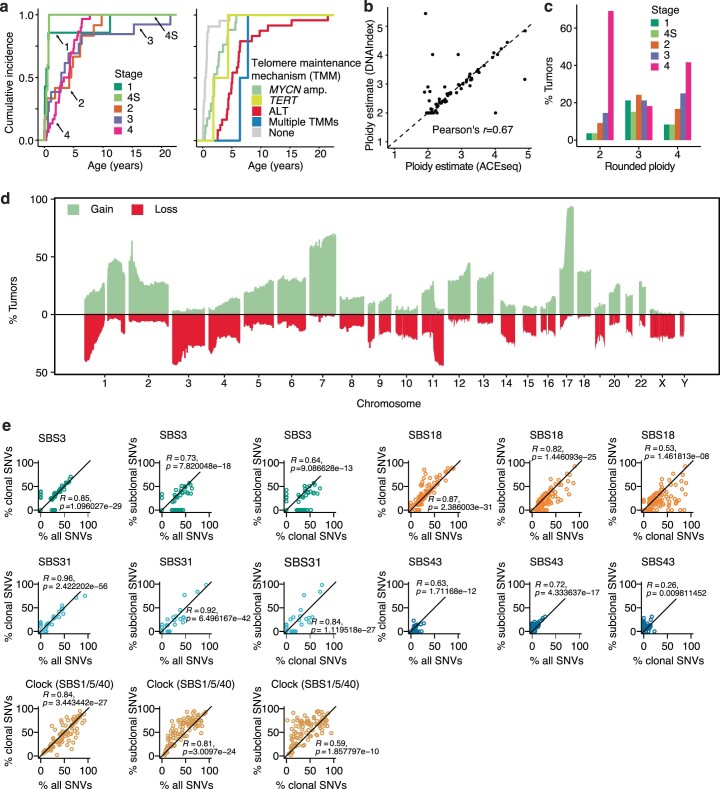
Extended Data Fig. 1. Copy number changes and mutational signatures in primary and relapsed neuroblastomas of the discovery cohort.
a, Age distribution at tumor diagnosis. b, Ploidy estimates based on WGS (inferred with ACEseq) and on DNA-index measurements (as measured by flow cytometry). Shown are 71 primary and relapsed tumors for which DNA-index was determined. c, Distribution of neuroblastoma stages among rounded ploidies. d, Overview of gains and losses across the tumor cohort. e, Comparison of mutational signatures (Cosmic v3) contributing to all SSNVs and to clonal and subclonal SSNVs (n = 100 primary and relapse tumors from the discovery cohort; Pearson’s correlation coefficients and two-sided P values are shown for each comparison).

