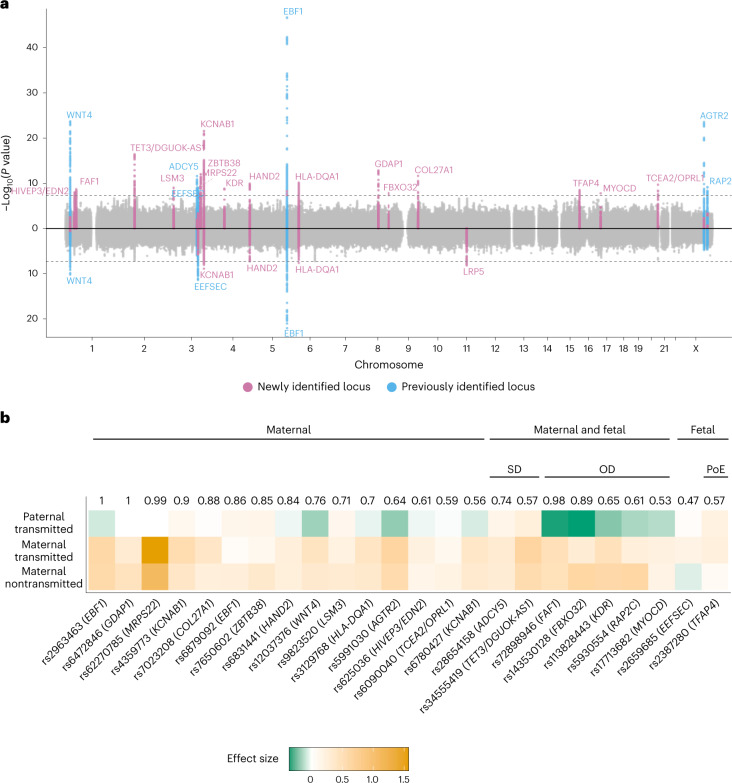
Fig. 1. GWAS of the timing of parturition and dissection of maternal–fetal effects.
a, Miami plot illustrating the GWAS for gestational duration (top) and preterm delivery (bottom). The x-axis shows the chromosome position and the y-axis the two-sided P-value of the fixed-effect inverse-variance weighted meta-analysis. The dashed line represents the genome-wide significance threshold (P = 5 × 10⁻⁸). Each genome-wide significant locus is labeled by its nearest protein-coding gene. b, Clustering of the effect origin for the index SNPs for gestational duration using transmitted and nontransmitted parental alleles (n = 136,833). Numbers depicted above the heatmap are the highest probability observed for that SNP, and group names define the cluster to which the highest probability refers to. The probabilities were estimated using model-based clustering. Heatmap represents effect size and effect direction for the parental transmitted and nontransmitted alleles. For comparison purposes, the maternal alleles with positive effects were chosen as reference alleles. Three major groups were identified according to the highest probability: maternal-only effect, fetal-only effect and maternal and fetal effect. Within variants with both maternal and fetal effects, two clusters were observed: same (SD) or opposite (OD) effect direction from maternal and fetal genomes. One of the fetal effects was further clustered as having a parent-of-origin effect (PoE), specifically, an effect from the maternal transmitted allele.

