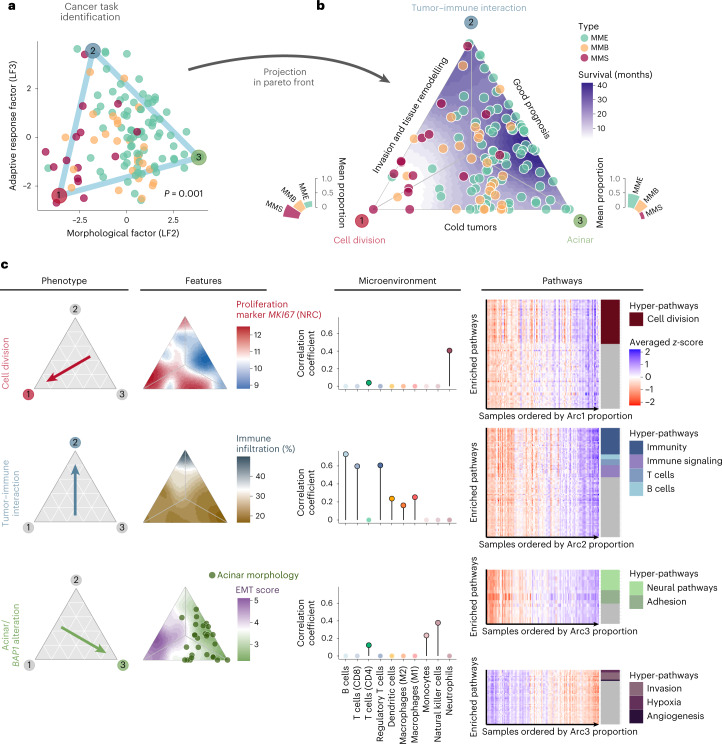
Fig. 2. Cancer task inference from the morphology and adaptive response factors (n = 120).
a, Sample positions along the morphological (LF2) and adaptive response factors (LF3) are contained within a triangle formed by three phenotypic archetypes (colored vertices). The P value corresponds to a one-sided test from the Pareto fit. b, Ternary plot representing the sample’s distance from the three specialized profiles. The bar plots represent the association between archetypes and histopathological types. c, Summary table of the main phenotypes, features and overexpressed pathways (columns) identified in each profile (rows). Left, arrows indicate the focal profile of each row. Middle left, ternary plots with a color-filled background representing key features for each profile. NRC, normalized read count. Middle right, lollipop plots presenting the correlation between RNA-seq-estimated immune cell infiltration and the proportion of archetypes. Right, expression heatmaps of cancer tasks inferred from each phenotype. The rows represent enriched pathways and the columns represent the samples, ordered by increasing phenotype proportion. The heatmap color scale corresponds to the averaged z score of each gene set. The colored tiles on the right annotate the gene sets that belong to the hyper-pathways inferred from each phenotype.

