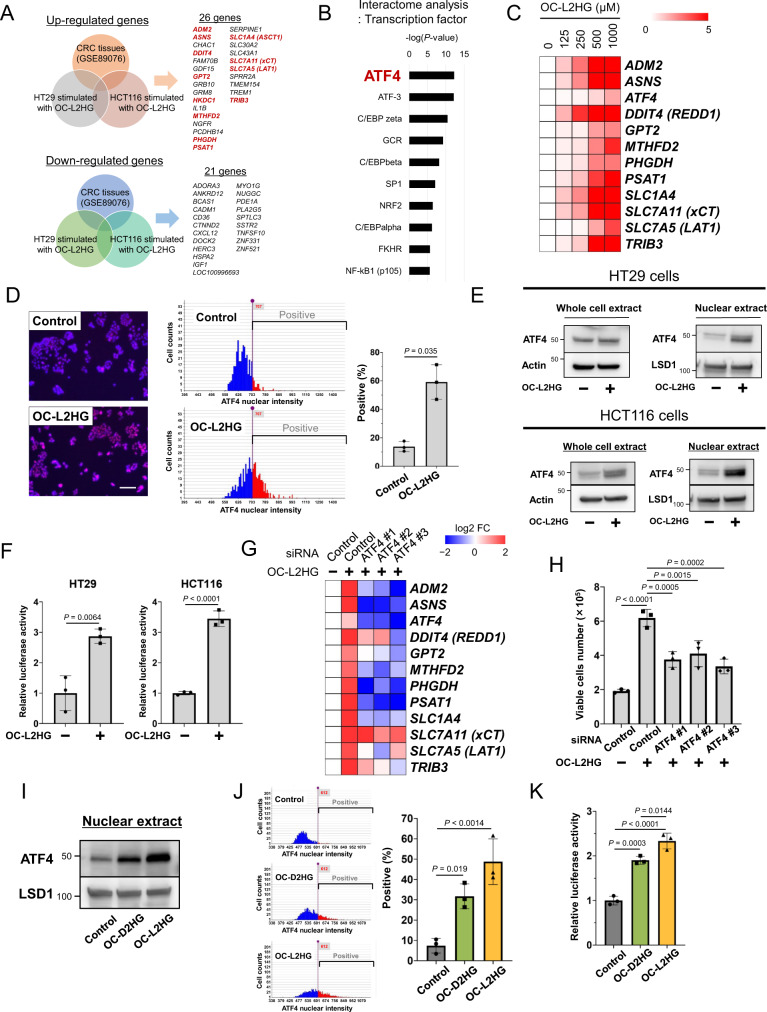
Fig. 2. L2HG induces ATF4 activation in CRC cells.
A Common up- or down-regulated genes in CRC tissues and OC-L2HG-stimulated HT29 and HCT116 cells. HT29 and HCT116 cells were treated with 500 μM OC-L2HG for 24 h. B Interactome analysis of transcription factors among the 26 genes upregulated by OC-L2HG. C Analysis of the mRNA expression of ATF4 and ATF4 target genes in HT29 cells treated with OC-L2HG for 24 h, using real-time PCR. Heat map showing the gene expression levels of cells stimulated with the indicated concentrations of OC-L2HG as a scaling ratio relative to unstimulated cells. D Immunofluorescence staining and quantification of ATF4 in HT29 cells treated with 500 μM OC-L2HG. Data represent the mean ± SD of three independent experiments. Scale bar, 200 μm. E ATF4 protein expression in the whole and nuclear fractions of HT29 and HCT116 cells treated with 500 μM OC-L2HG. F Transcriptional activity of ATF4 in HT29 and HCT116 cells treated with 500 μM OC-L2HG (see Methods). Data represent the mean ± SD of three independent experiments. G Effect of ATF4 knockdown on the mRNA expression of ATF4 target genes in HT29 cells treated with 500 μM OC-L2HG. mRNA levels in each sample were converted to a log2 fold-change relative to the control. Red and blue indicate higher and lower levels, respectively, compared to the control (white). H Effect of ATF4 knockdown on the viability of CaR1 cells treated with L2HG (250 μM) under serum-free conditions for 6 d. Viable cells were counted using a trypan blue exclusion assay. Data represent the mean ± SD of three independent experiments. I, J Expression levels of nuclear ATF4 in HT29 cells treated with 500 μM OC-L2HG or 500 μM OC-D2HG for 24 h. Nuclear ATF4 expression was measured using western blotting (I) and immunofluorescence staining (J). Data represent the mean ± SD of three independent experiments. K Transcriptional activity of ATF4 in HT29 and HCT116 cells treated with OC-L2HG or OC-D2HG. Data represent the mean ± SD of three independent experiments.

