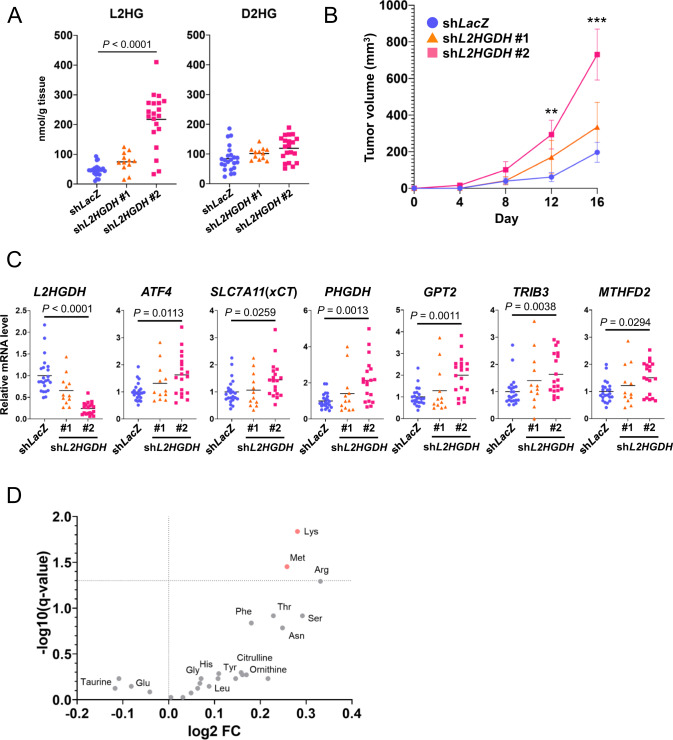
Fig. 7. L2HGDH knockdown increases tumor growth and alters amino acid metabolism in vivo.
A L2HG and D2HG levels in tumors derived from control (shLacZ, n = 23), L2HGDH-knockdown (shL2HGDH #1, n = 12; shL2HGDH #2, n = 20) HT29 cells. B Rate of growth following subcutaneous implantation of shLacZ (n = 23), shL2HGDH #1 (n = 12), and shL2HGDH #2 (n = 21) HT29 cells. Data represent the mean ± SEM. **P < 0.01 and ***P < 0.001. C mRNA expression of L2HGDH, ATF4, and ATF4 target genes in tumors derived from shLacZ (n = 23), shL2HGDH #1 (n = 12), and shL2HGDH #2 (n = 19) HT29 cells. D Volcano plot showing the levels of amino acids that were significantly altered in in tumors derived from shLacZ (n = 16) and shL2HGDH #2 (n = 14) HT29 cells. Red dots indicate significantly upregulated amino acids. Levels of amino acids were detected using capillary electrophoresis time-of-flight mass spectrometry.

