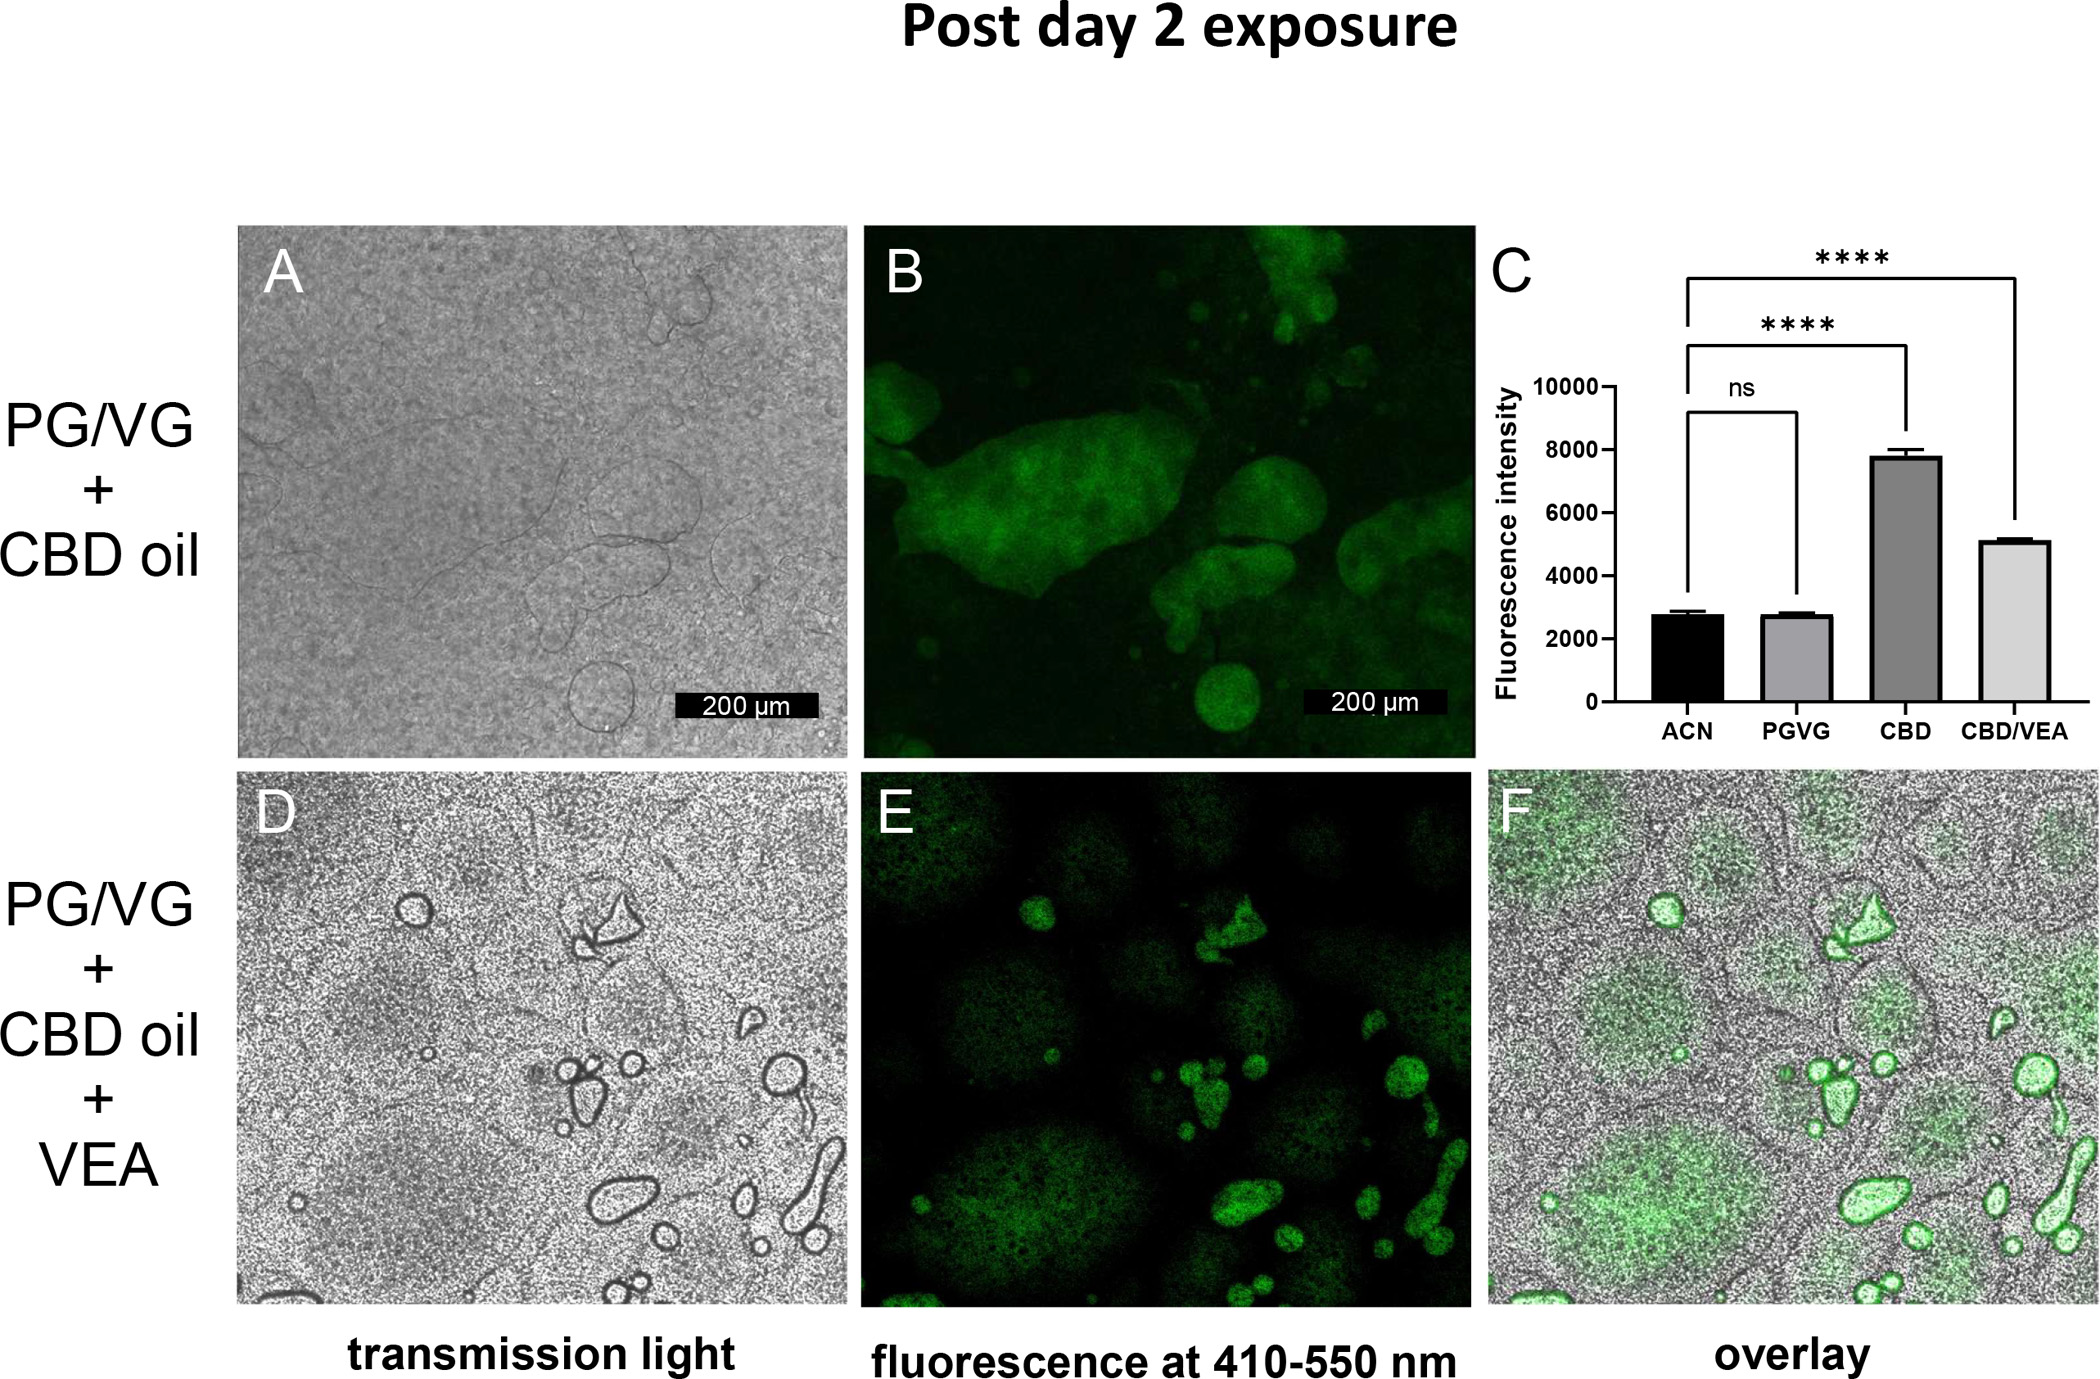
Figure 3: Aerosolized CBD oil and VEA accumulate on and in HBE cultures 2 h post day 2 exposures.

HBE culture insert exposed to PG/VG plus CBD oil, (A) transmission light micrograph, (B) fluorescence at 410–550 nm. (C) Plate reader fluorescence intensities of diluted e-liquids in solvent acetonitrile (ACN). HBEC inserts exposed to PG/VG + CBD oil + VEA. Bar graphs present means and standard deviation values are indicated by horizontal bars. Statistical significance was determined by ANOVA and multiple comparison analysis, and the p-value is indicated by **** ≤ 0.001. (D) Transmission light micrograph, (E) fluorescence at 410–550 nm, and (F) overlay. Representative images were collected from n=6 biological replicate cultures per exposure condition. Scale bar = 200 μm.
