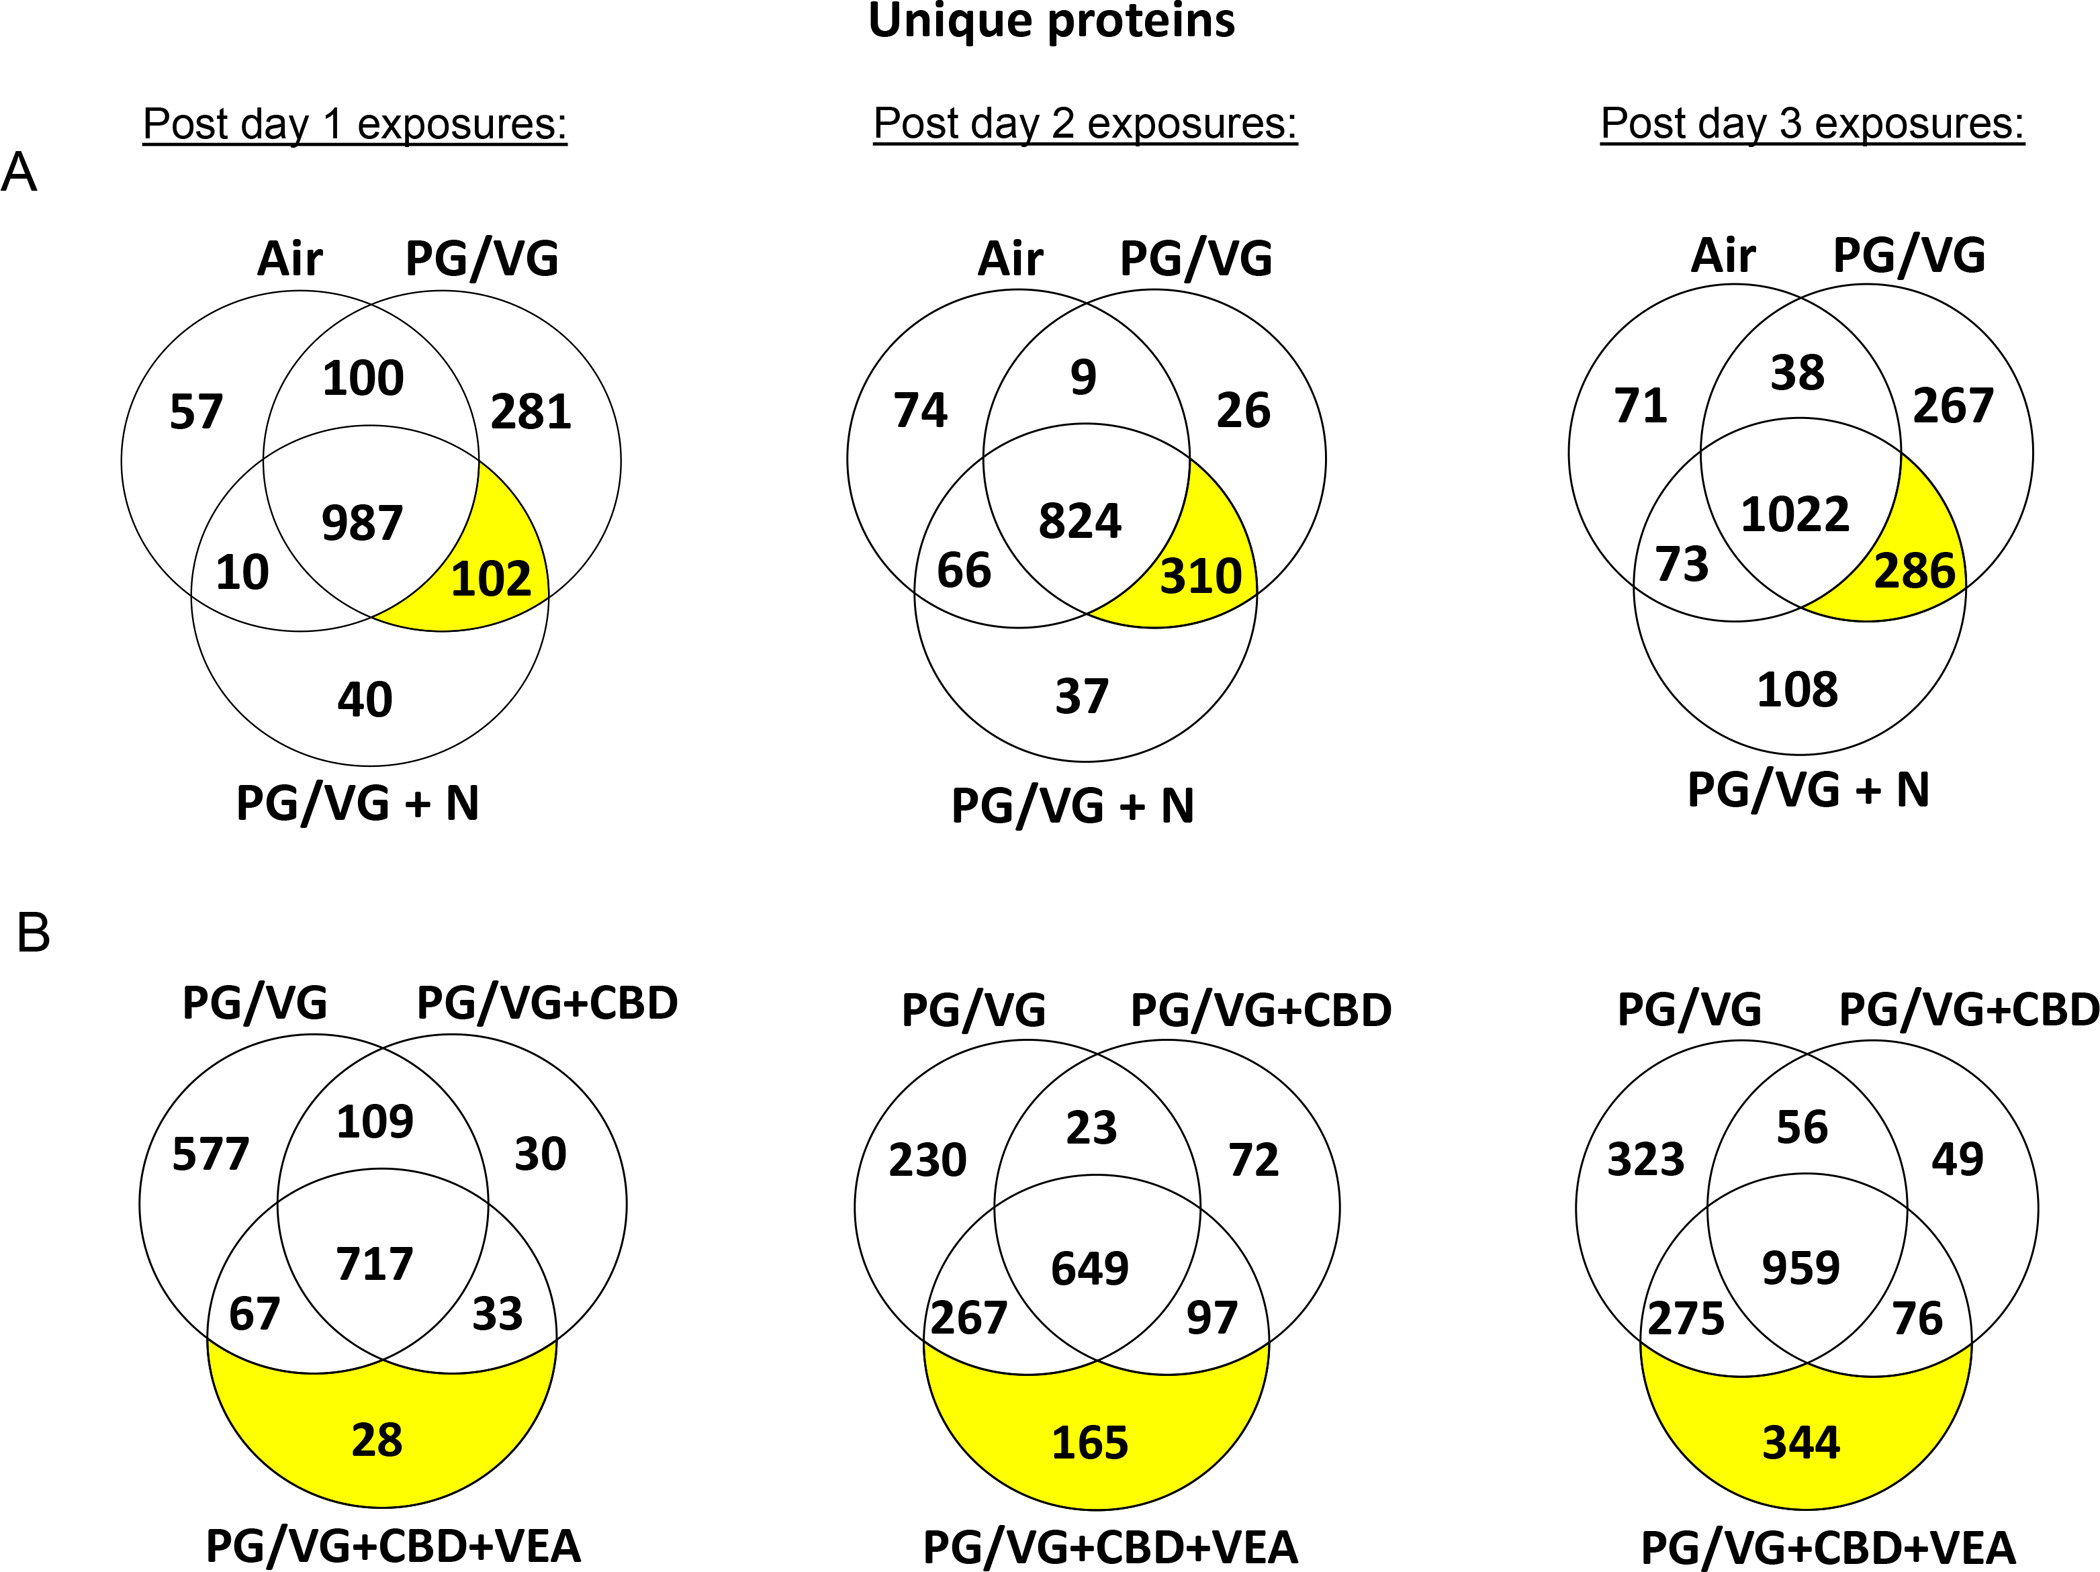
Figure 5: CBD oil, VEA and PG/VG aerosol exposures show differential proteome composition changes in the HBE apical surface liquid.

Venn diagrams show the numbers of uniquely identified proteins in each exposure group and day for (A) air versus PG/VG and PG/VG+N and (B) PG/VG versus PG/VG+CBD oil and PG/VG+CBD oil+VEA-exposed HBE cultures. The analysis of the uniquely identified protein distributions shows that PG/VG alone, PG/VG+CBD oil and PG/VG+CBD oil+VEA each had unique effects on the proteomic composition of the HBE apical surface liquid.
