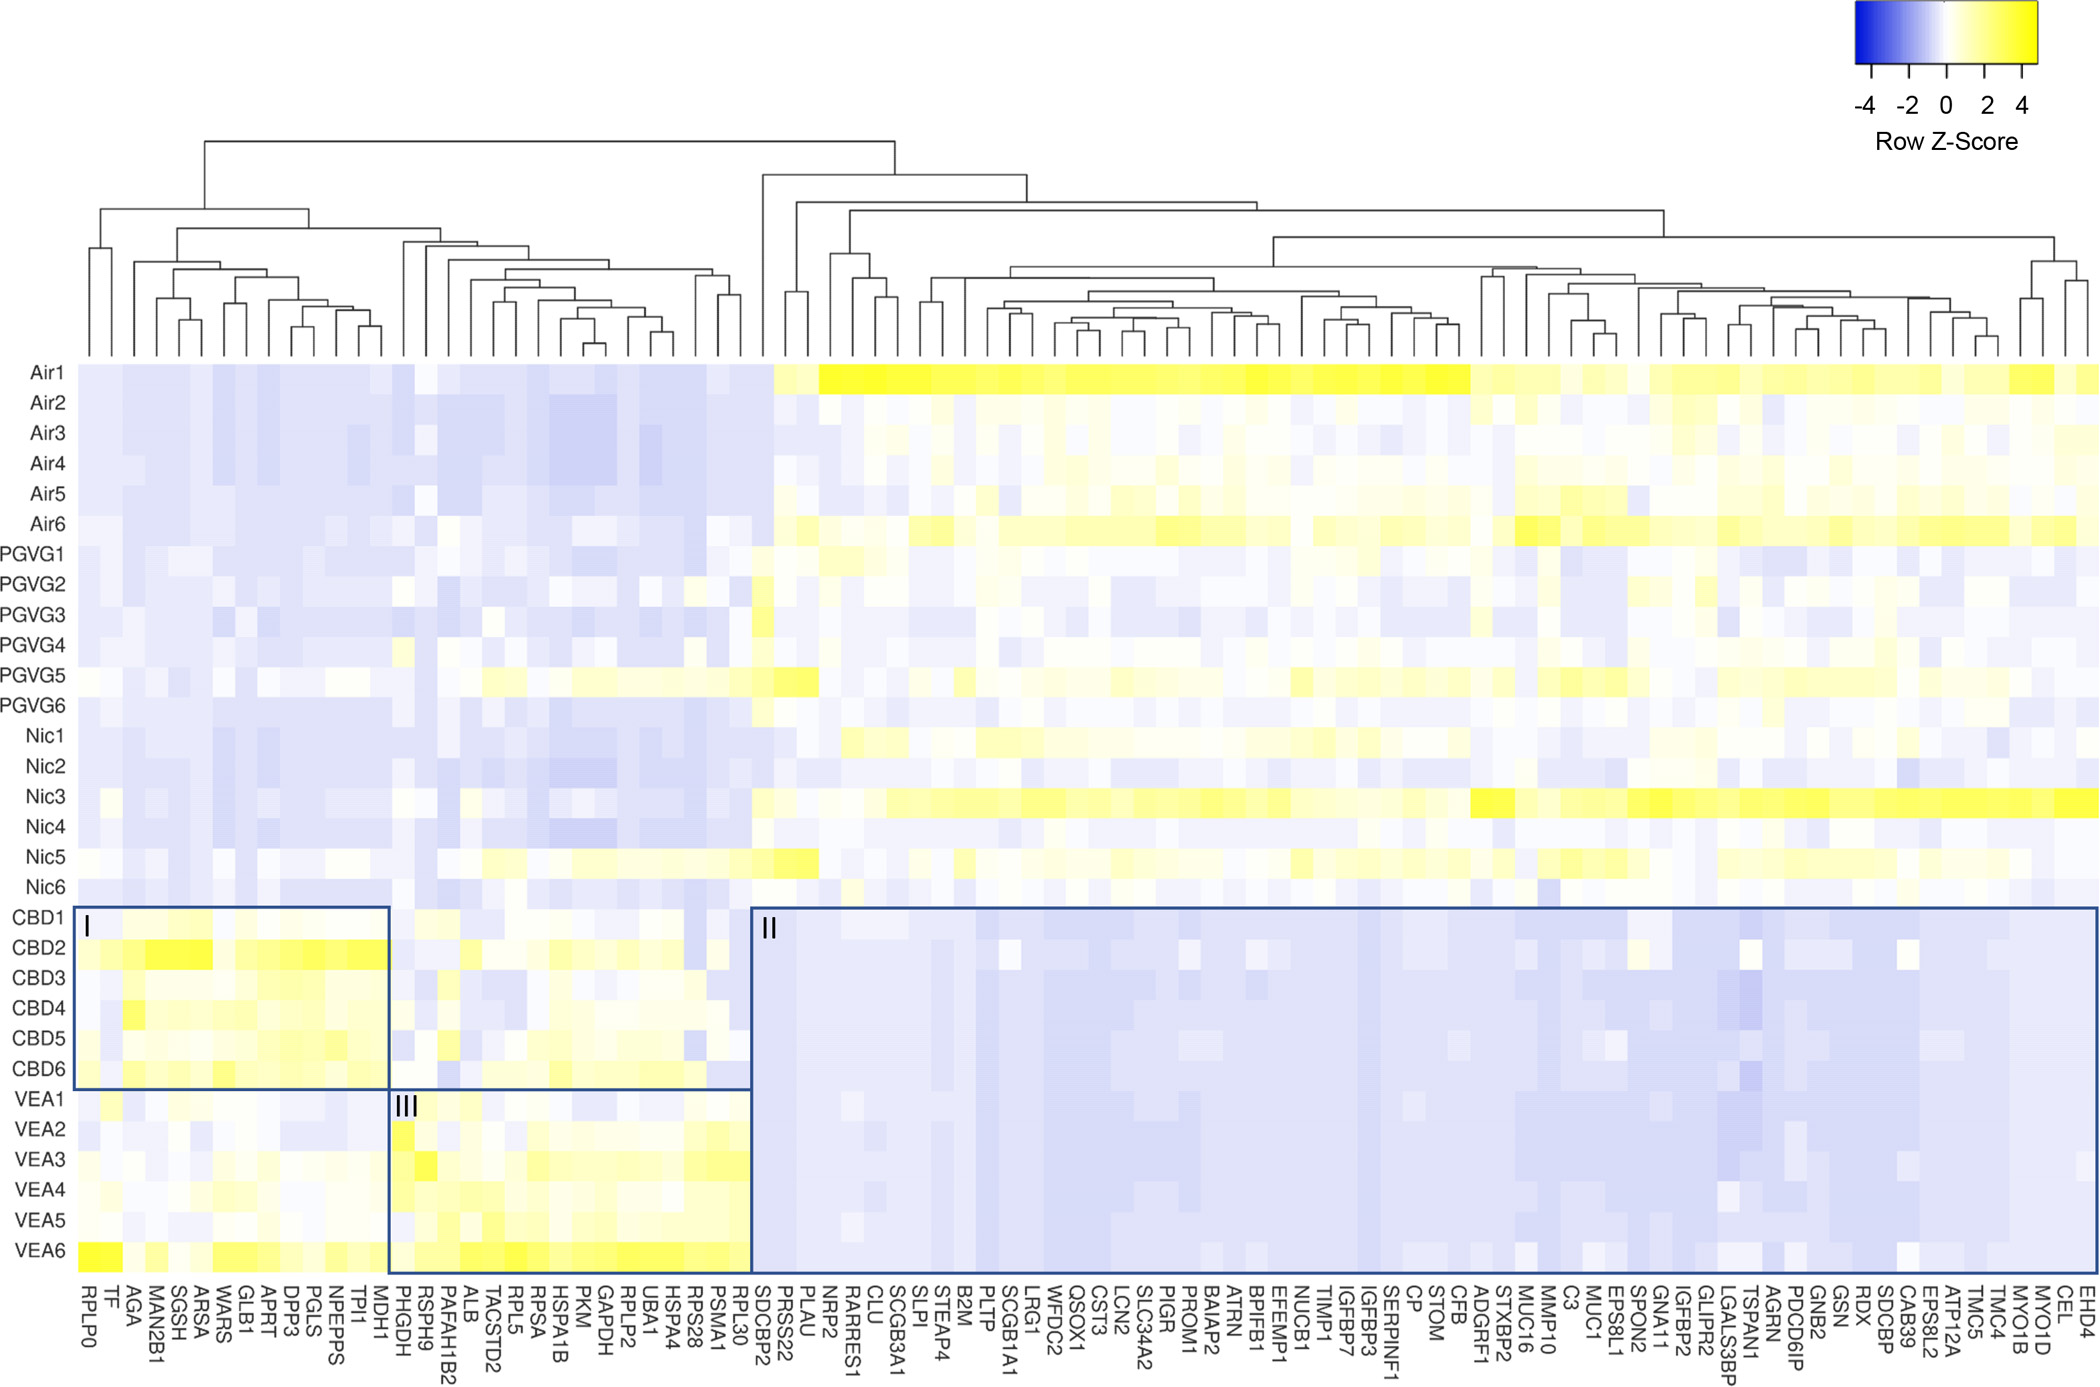
Figure 8: Heatmap of proteins that displayed significantly altered levels in the HBE apical lining fluid after PG/VG+CBD oil+VEA aerosol exposure.

The heatmap includes 91 proteins that were selected based on their significant (p<0.05) difference in abundance between PG/VG and PG/VG+CBD oil+VEA after the 2nd exposure, as determined by the Wilcoxon signed rank test. Among clustering areas, three are highlighted by rectangles labeled I, II and III.
