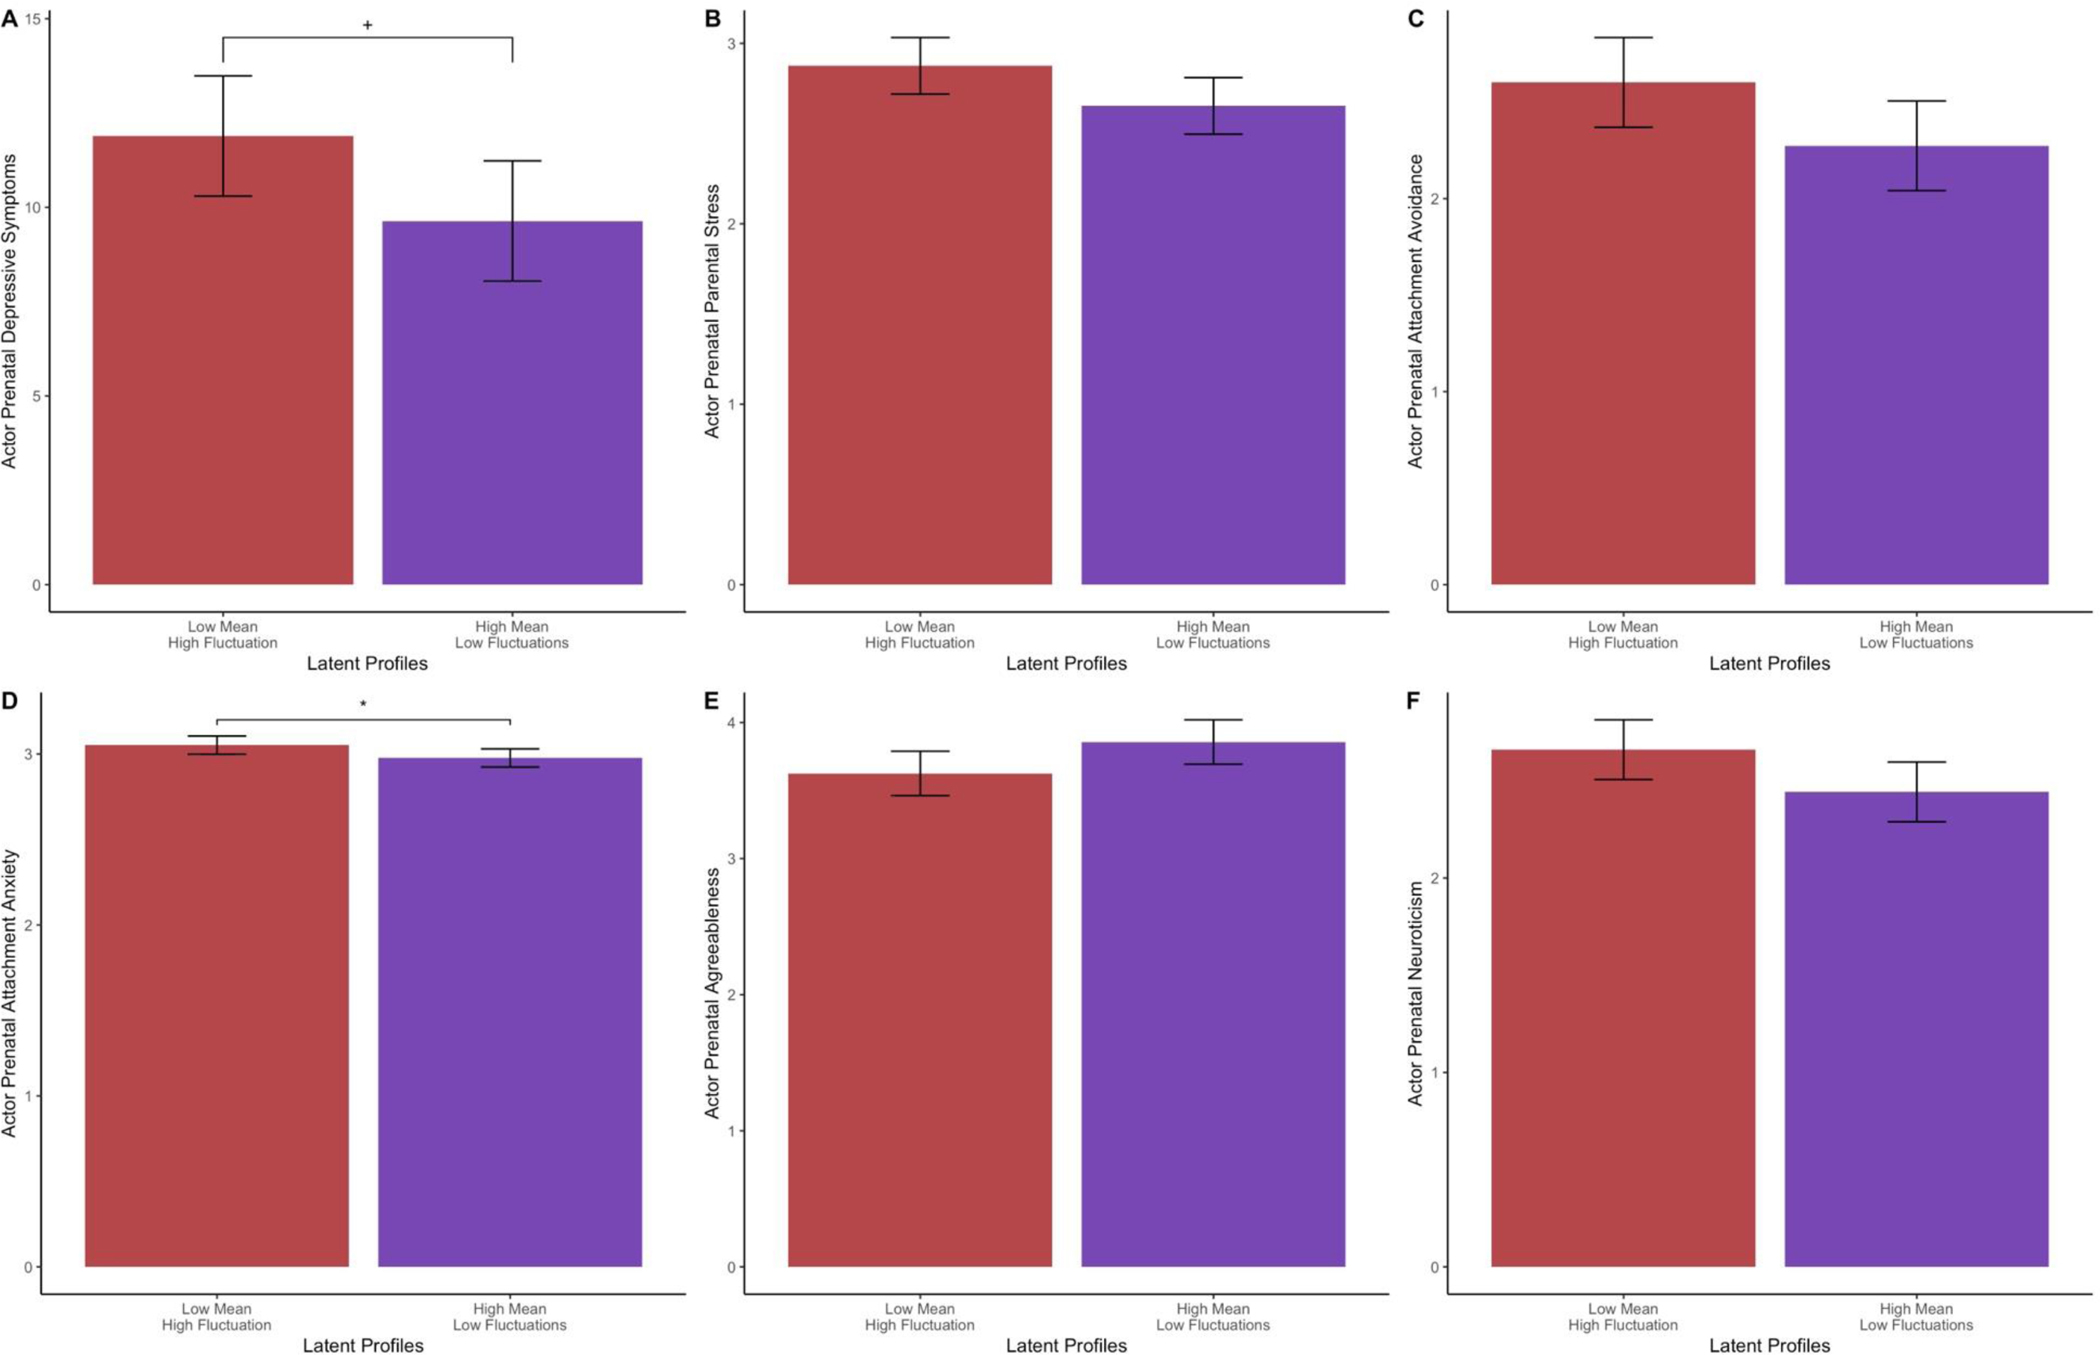
Figure 4. Study 2 t-test Provided Support Latent Profile Comparisons.

Note: + p < .08; * p < .05; Full tables with descriptive statistics for each profile and partner variables are presented in the OSM.

Note: + p < .08; * p < .05; Full tables with descriptive statistics for each profile and partner variables are presented in the OSM.