
Figure 1: Fasting reorganizes the leukocyte distribution landscape.
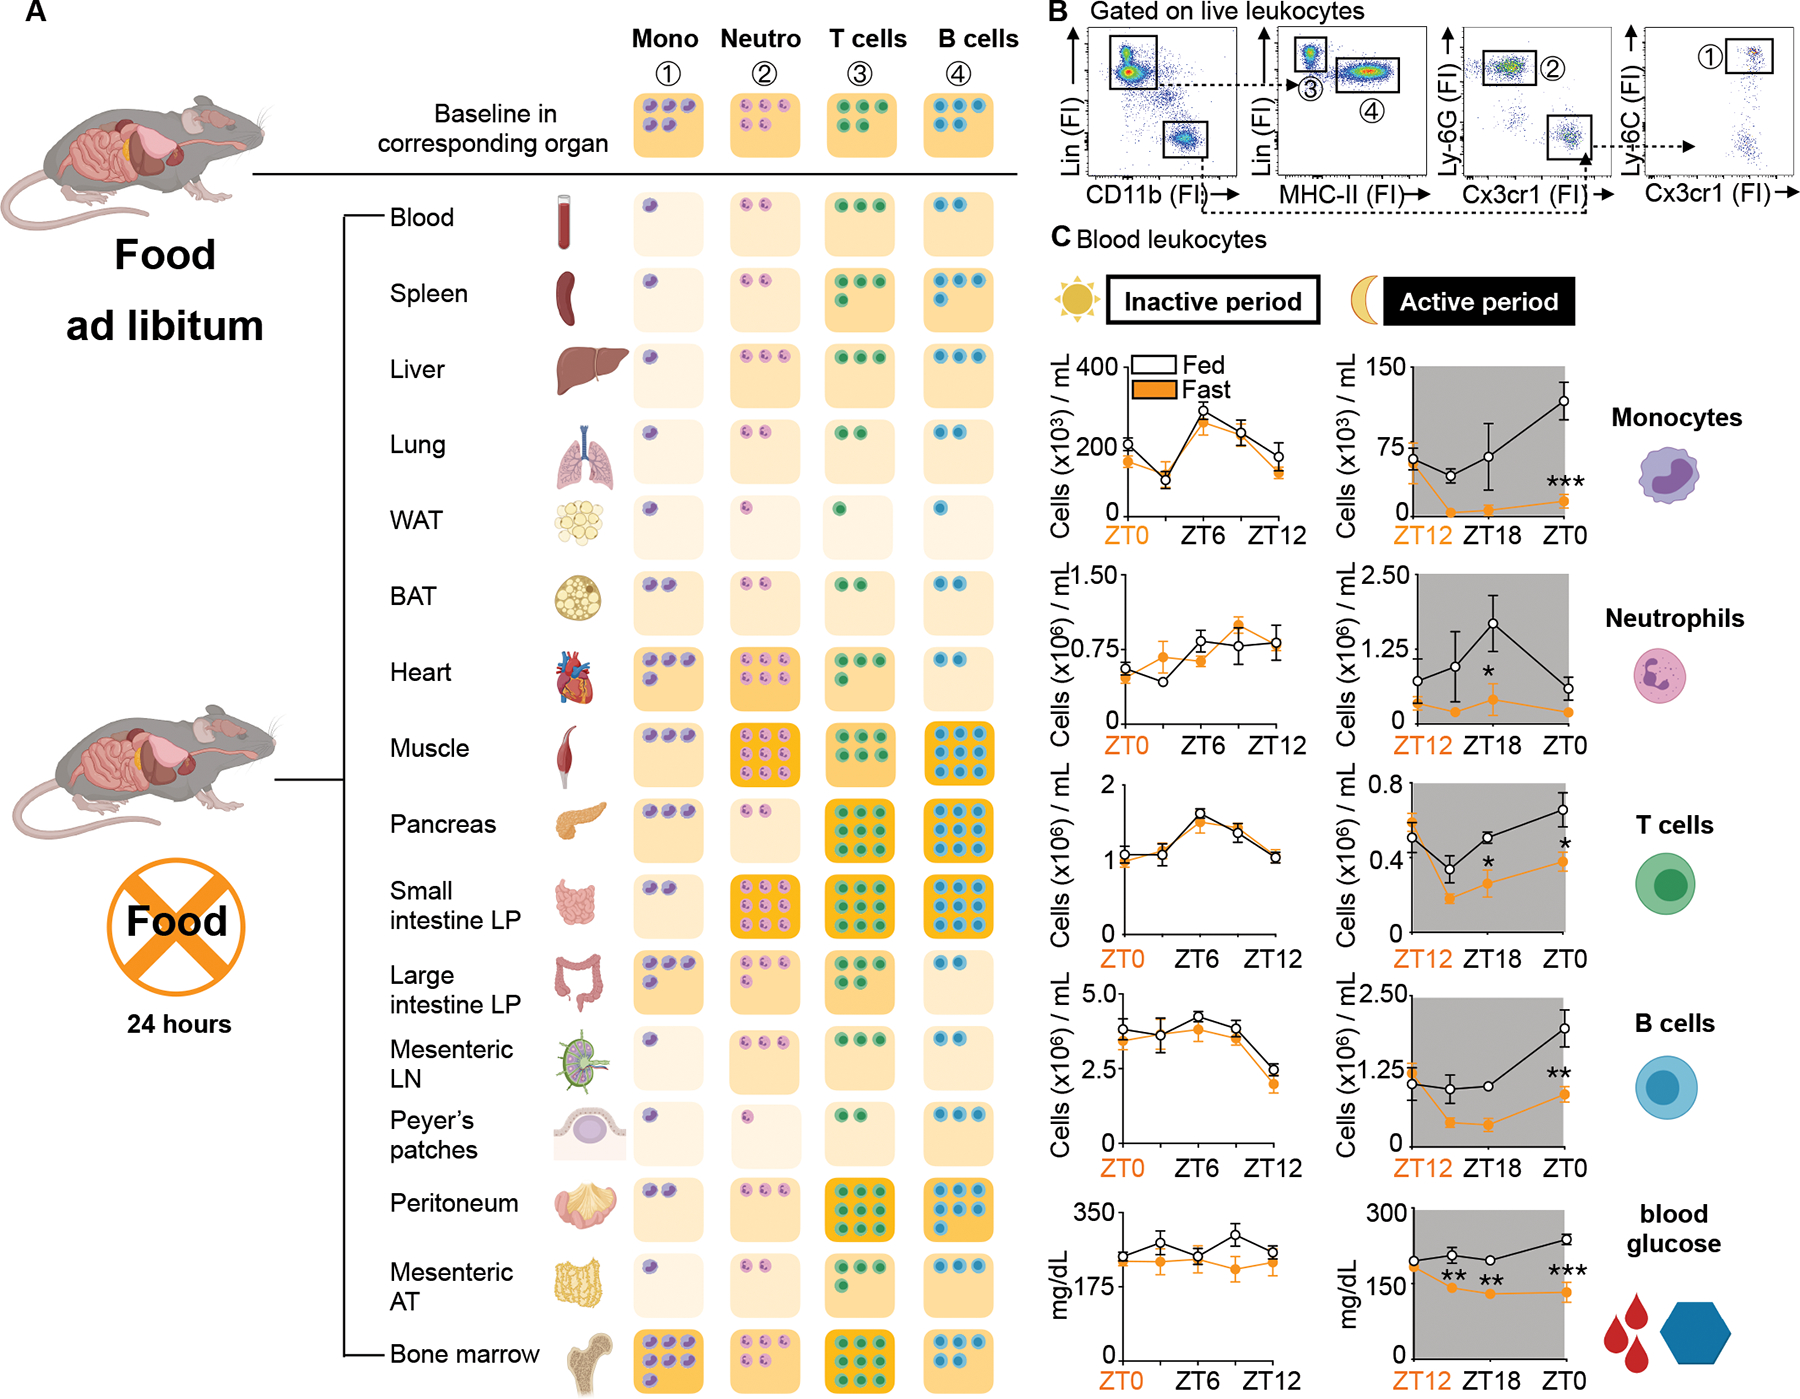
A. Relative shifts of major leukocyte populations in depicted organs compared between mice fed ad libitum and after a 24h fast. Baseline cell content in each organ is defined as “5 cells”. Fasted results are calculated in relative relation to fed. Ly-6Chi monocytes are defined as CD45+ CD11b+ LIN1(CD19, CD3, NK 1.1, CD90−) Ly-6G− CX3CR1+ Ly-6Chi, neutrophils as CD45+ CD11b+ LIN1− Ly-6G+, T cells as CD45+ CD11b− LIN1+ MHCII−, B cells as CD45+ CD11b− LIN1+ MHCII+. Absolute numbers for each organ are depicted in Table 1. (n=3–5 mice per group). Unpaired t test.
B. Representative gating strategy of all major leukocyte populations in the blood.
C. Absolute blood leukocyte count and blood glucose concentration divided by inactive (light) and active (dark) period compared between mice fed ad libitum or fasted for up to 12h. Orange zeitgeber (ZT) indicates start of the fast (n=3–10 per group). Two-way ANOVA. Data presented as mean ±SEM, *p < 0.05, **p<0.01, ***p < 0.001. Mono: Ly-6Chi monocytes, Neutro: Neutrophils, WAT: White adipose tissue, BAT: Brown adipose tissue, LP: Lamina propria, LN: Lymph node, AT: Adipose tissue, FI: Fluorescence intensity, ZT: Zeitgeber. Please also see Table 1 and Supplement Table 1.