
Figure 6. Fasting and re-feeding alters host response to infection.
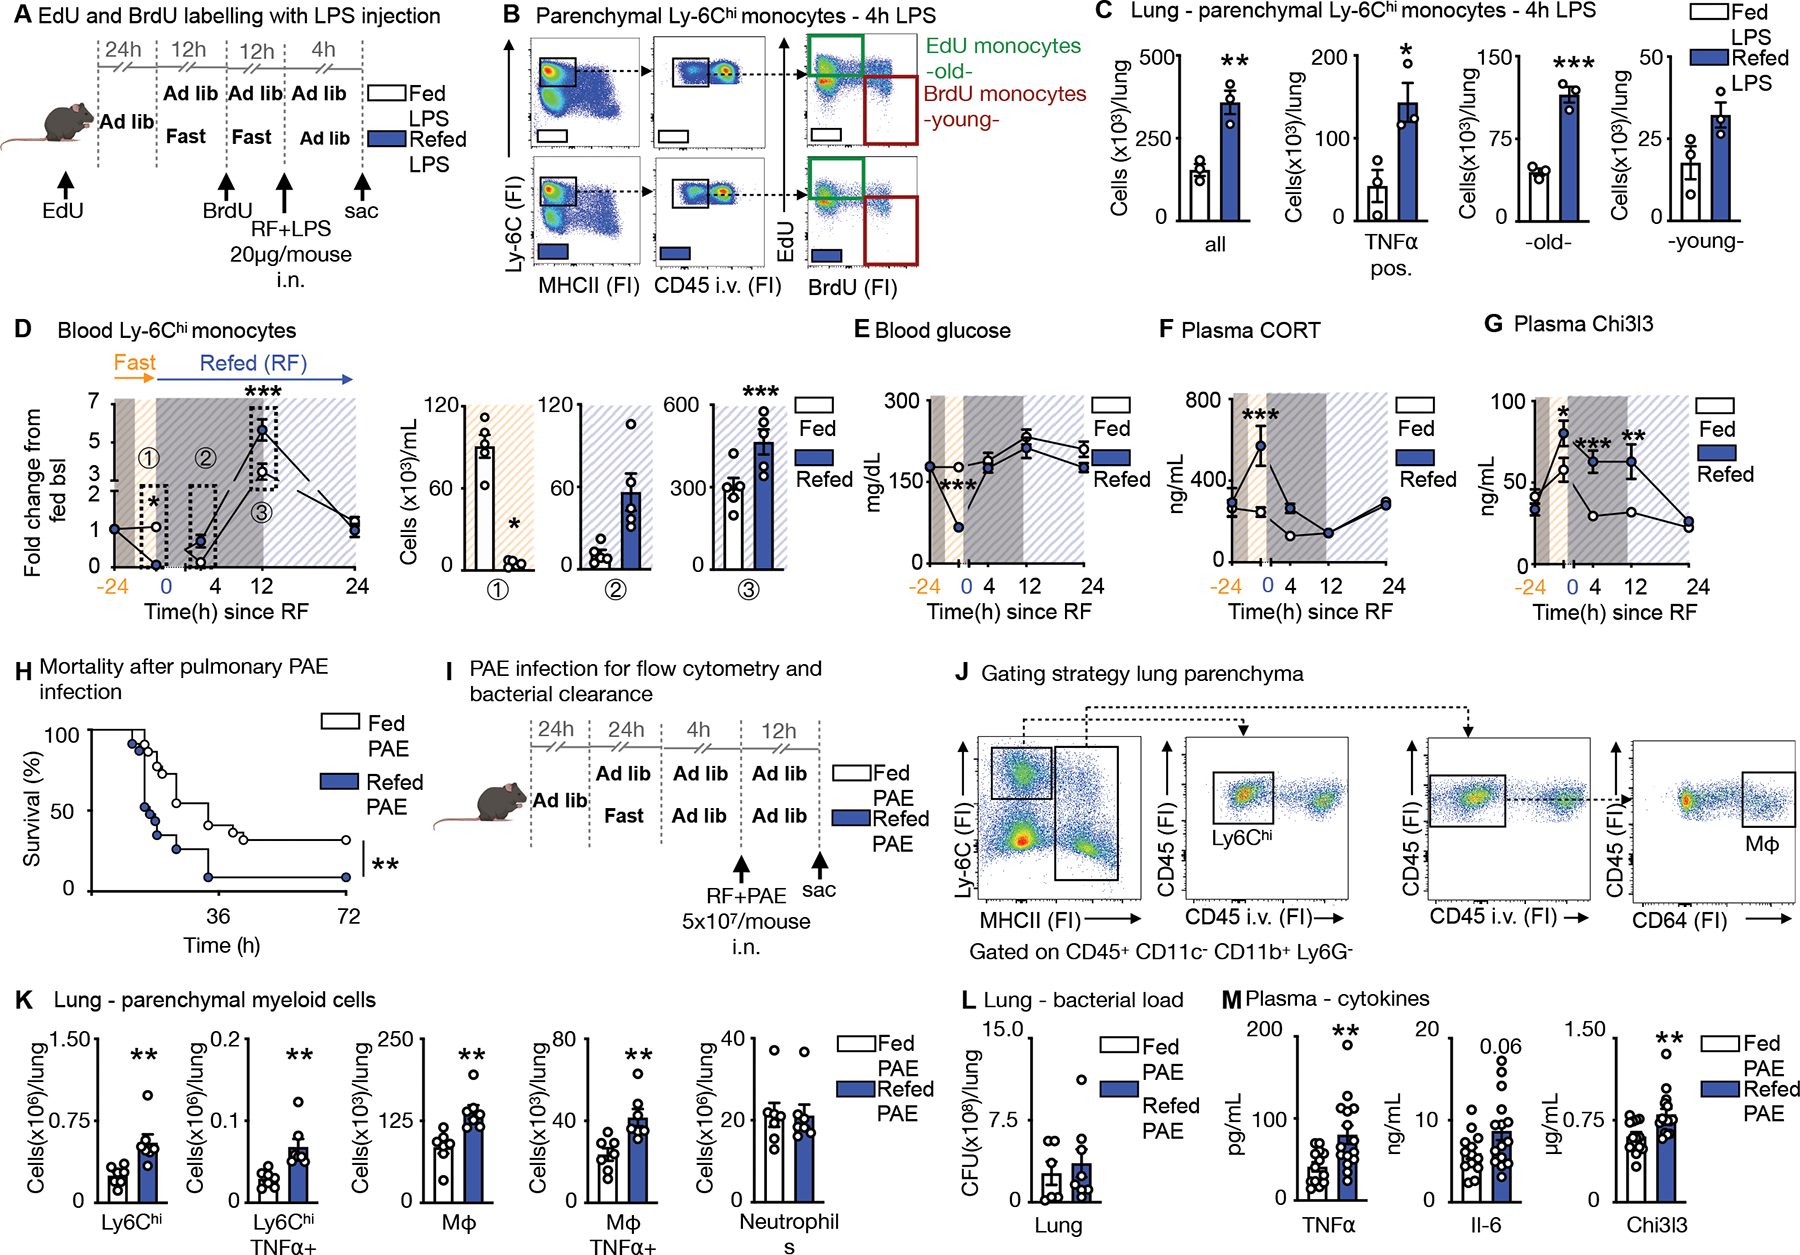
A. EdU and BrdU were sequentially injected for labelling of Ly-6Chi monocytes in mice under feeding ad libitum and fasting+re-feeding conditions. EdU was injected 24h prior to fasting. BrdU was injected half-way through the fast. After a 24h fast, fasted mice were refed for 4h. LPS (20μg/mouse) was administered intranasally at the timepoint of re-feeding and mice sacrificed 4h later.
B. Representative flow cytometry plots for double labelling of Ly-6Chi monocytes in the lung parenchyma. Intravascular Ly-6Chi monocytes were excluded by intravenous CD45 staining prior to sacrifice. Ly-6Chi monocytes are defined as CD45+ CD11b+ LIN1− Ly-6G− CX3CR1+ MHCII− Ly-6Chi. EdU monocytes are Ly-6Chi monocytes with EdU-only label (labelled prior to fasting, old). BrdU monocytes are Ly-6Chi monocytes with BrdU-only label (labelled under fasting, young). (n=3 per group)
C. Absolute count of Ly-6Chi monocytes and TNFα-positive Ly-6Chi monocytes in the parenchyma after intranasal LPS challenge in mice undergoing feeding ad libitum or fasting+re-feeding. Absolute counts of “old” and “young” Ly-6Chi monocytes in the parenychma. “Old” are Ly-6Chi monocytes with EdU-only label. “Young” are Ly-6Chi monocytes with BrdU-only label (n=3 per group). Unpaired t test.
D. Blood Ly-6Chi monocytes under feeding or fasting+re-feeding conditions followed for 24h after re-feeding normalized to group’s baseline before fasting. Orange −24h indicates baseline before start of a 24h fast. Blue 0 indicates start of re-feeding. Bar graphs represent absolute Ly-6Chi monocytes counts of indicated timepoints (n=4–5 per group, timepoints are independent experiments). Two-way ANOVA.
E. Blood glucose under feeding or fasting+re-feeding conditions followed for 24h after re-feeding. Orange −24h indicates baseline before start of a 24h fast. Blue 0 indicates start of re-feeding (n=4–5 per group, timepoints are independent experiments). Two-way ANOVA.
F. Plasma corticosterone (CORT) under under feeding or fasting+re-feeding conditions followed for 24h after re-feeding. Orange −24h indicates baseline before start of a 24h fast. Blue 0 indicates start of re-feeding (n=4–5 per group, timepoints are independent experiments). Two-way ANOVA.
G. Plasma Chi3l3 concentration under feeding or fasting+re-feeding conditions followed for 24h after re-feeding. Orange −24h indicates baseline before start of a 24h fast. Blue 0 indicates start of re-feeding (n=4–5 per group, timepoints are independent experiments). Two-way ANOVA.
H. Mice were infected intranasally with Pseudomonas aeruginosa (PAE) at a dose of 5×10⁷/mouse. Refed mice were infected after a 24h fast, followed by a 4h re-feeding period. Control mice were fed ad libitum and both groups followed for survival (n= 22–23 per group, two independent experiments combined). Log-rank (Mantel-Cox) test.
I. Fed ad libitum mice and mice after 24h fast followed by 4h of re-feeding were intranasally infected with PAE at a dose of 5×10⁷/mouse and sacrificed 12h after.
J. To distinguish between circulating and parenchymal leukocytes, CD45 was injected i.v. before sacrifice. Representative gating strategy for flow cytometery on parenchymal Ly-6Chi monocytes defined as CD45+CD11c−CD11b+Ly6G−Ly-6Chi MHCII− and macrophages (Mφ) defined as CD45+CD11c−CD11b+Ly6G−MHCII+CD64+ in the lung. (n=7 per group)
K. Parenchymal myeloid cell content in the lung after infection with PAE as described in panel I (n=7 per group). Unpaired t test.
L. Bacterial load after infection as described in panel I from homogenized lungs comparing fed and fasted+re-fed mice (n=6–8 per group). Unpaired t test.
M. Plasma concentration of cytokines after infection as described in panel I (n=13–15 per group, two experiments combined). Unpaired t test. Data presented as mean ±SEM, *p < 0.05, **p<0.01, ***p < 0.001. FI: Fluorescence intensity, RF: Re-feeding, PAE: Pseudomonas aeruginosa, Mφ: Macrophages. Please also see Figure S5 and S6.