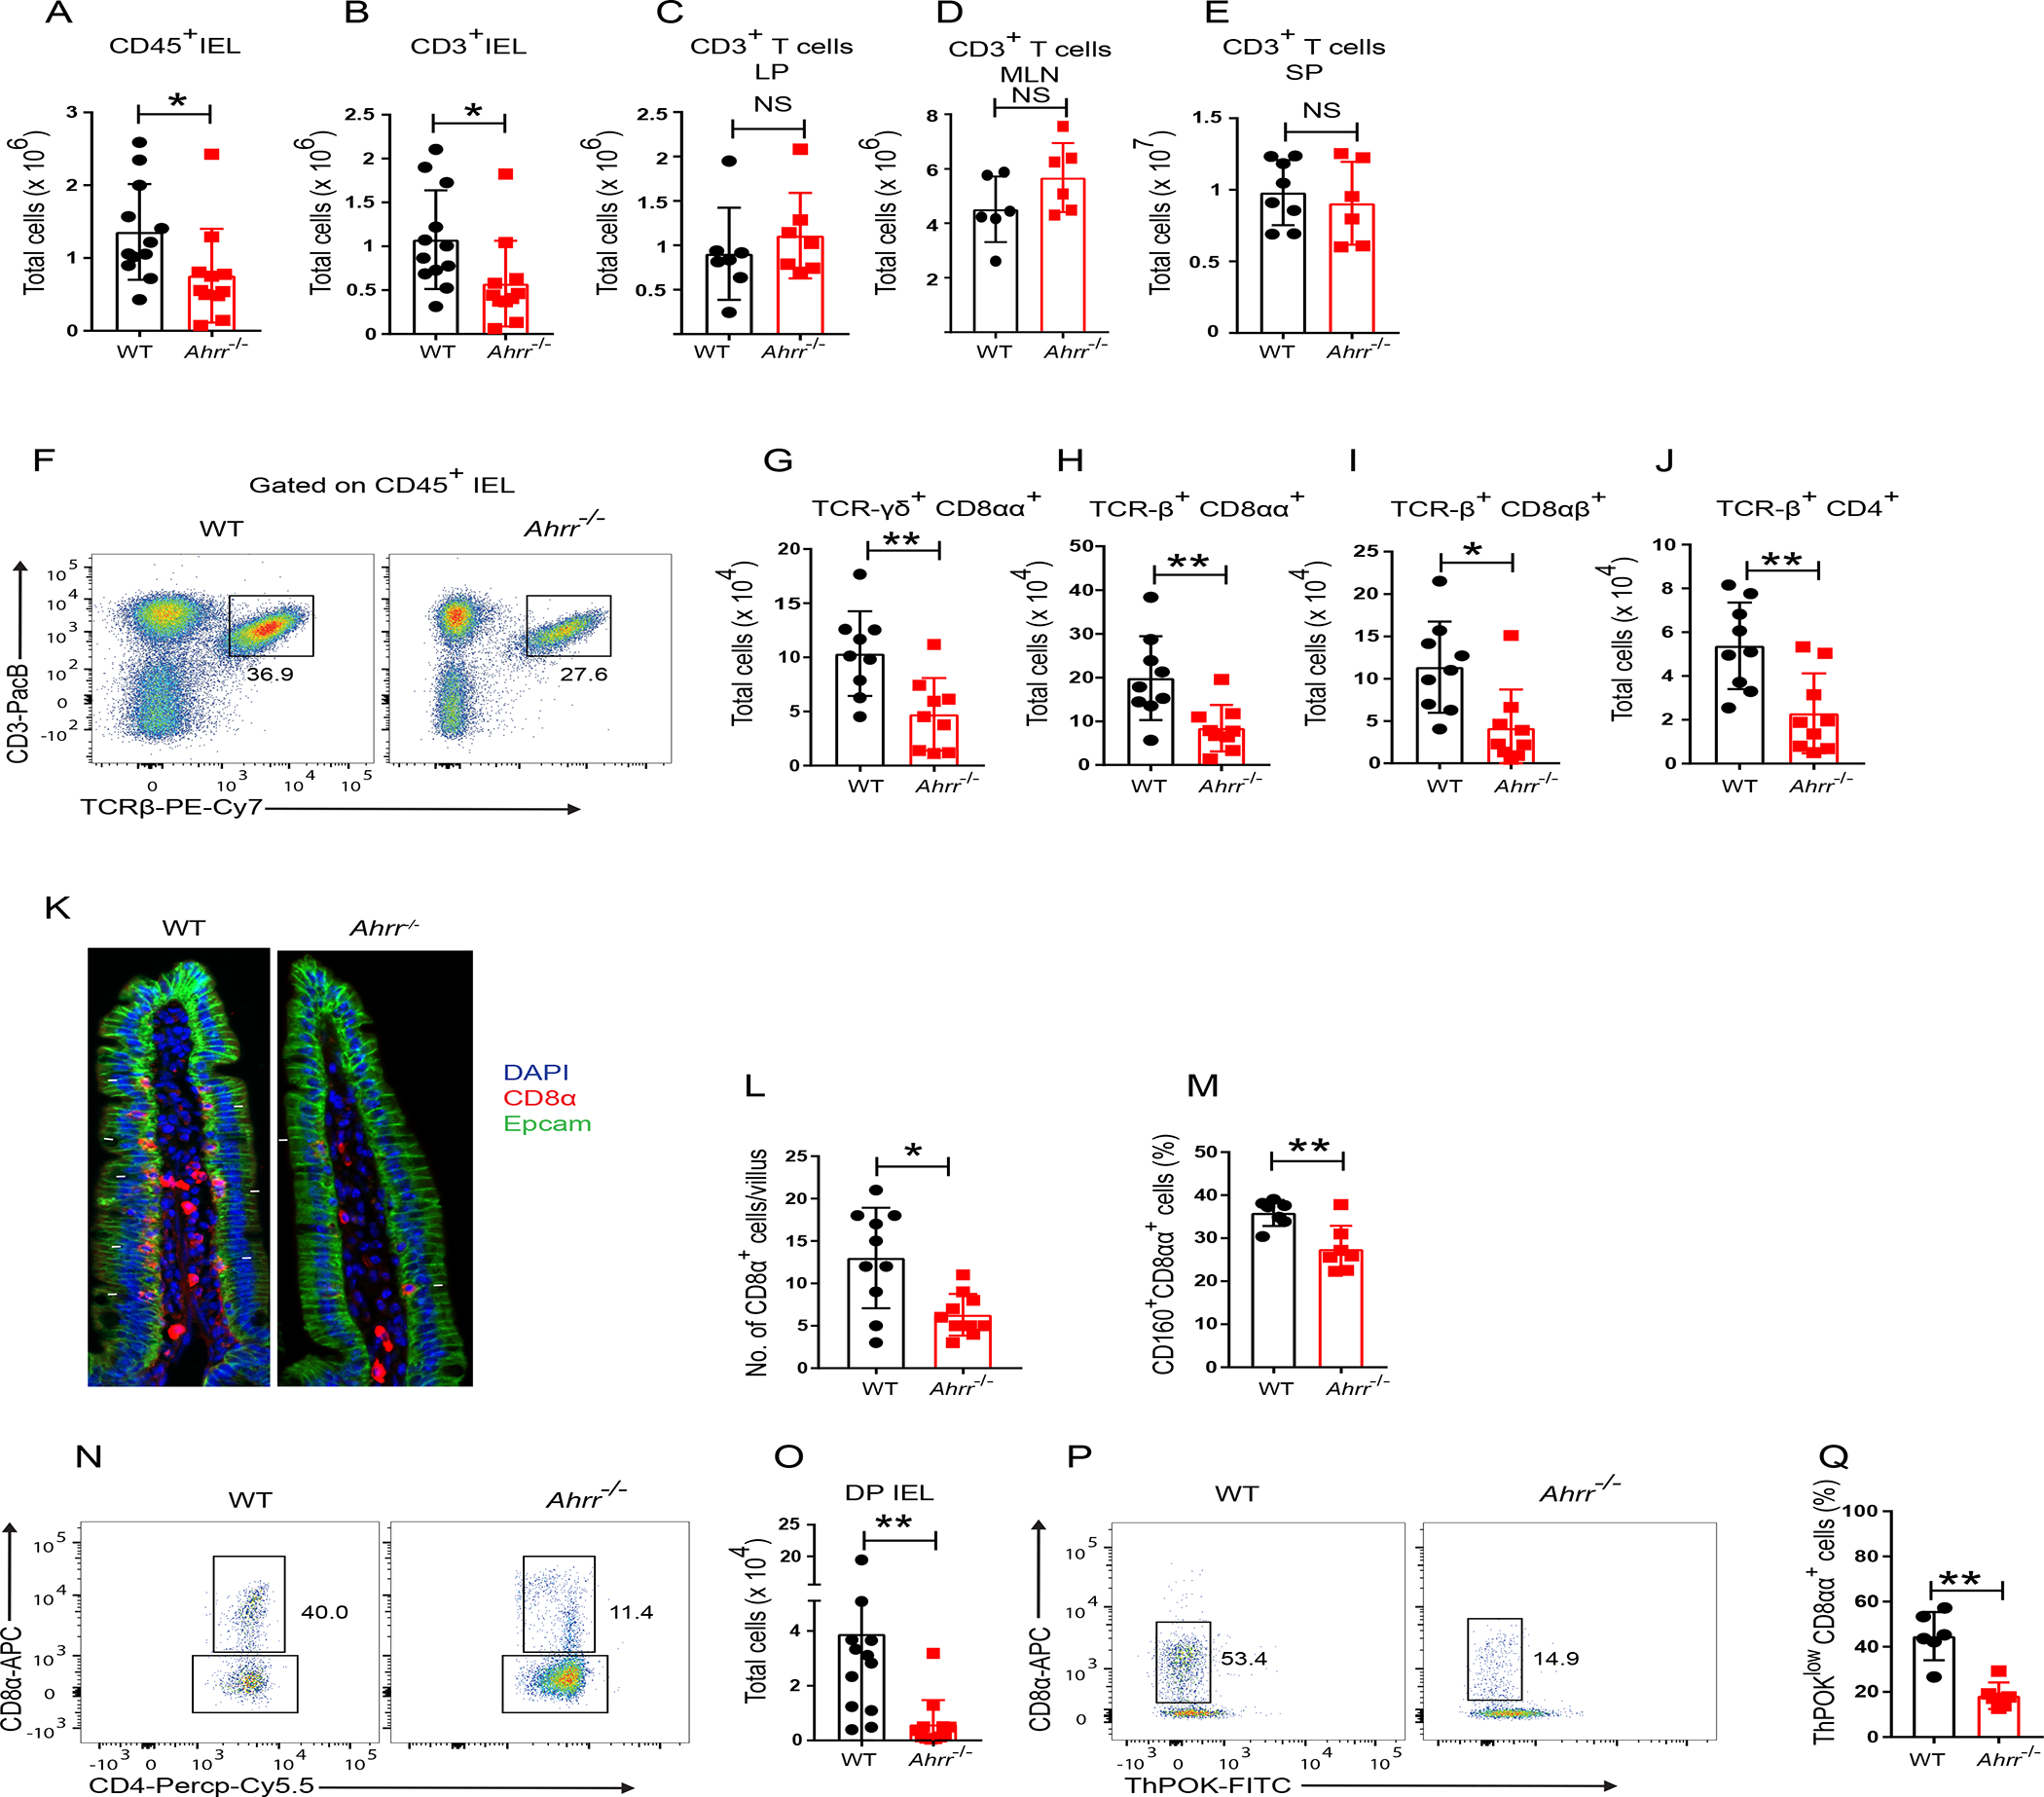
Figure 1. Ahrr−/− mice have reduced numbers of IEL.

(A) Numbers of CD45+ IEL in the small intestine of WT and Ahrr−/− mice. (B-E) Numbers of T cells in small intestinal epithelium (B), small intestinal lamina propria (C), mesenteric lymph nodes (D) and spleen (E) of WT and Ahrr−/− mice. (F) Representative flow cytometry plots depicting frequency of TCR-β+ IEL in WT and Ahrr−/− mice. (G-J) IEL populations in small intestinal epithelium of WT and Ahrr−/− mice, including TCR-γδ+ CD8αα+ (G), TCR-β+ CD8αα+ (H), TCR-β+ CD8αβ+ (I), and TCR-β+ CD4+ (J). (K) Immunofluorescence staining of CD8α in the small intestine of WT and Ahrr−/− mice. (l) Quantification of CD8α+ cells per villus of WT and Ahrr−/− mice. (M) Frequency of CD160+ TCR-β+ CD8αα+ IELs in WT and Ahrr−/− mice. (N, O) Representative flow cytometry plots (N) and numbers of DP IEL (O) in WT and Ahrr−/− mice (gated on CD45+, CD3+, TCR γδ−, TCRαβ+, CD8β− CD4+ IEL). (P and Q) Representative flow cytometry plots plots (P) and frequency of ThPOKlow CD8αα+ cells (Q) in WT and Ahrr−/− mice. Each dot represents an individual mouse. Data are pool or representative of 2–3 individual experiments. Statistical significance was determined by Mann-Whitney test. *P<0.05, **P<0.01. Please also see Figures S1 and S2.
