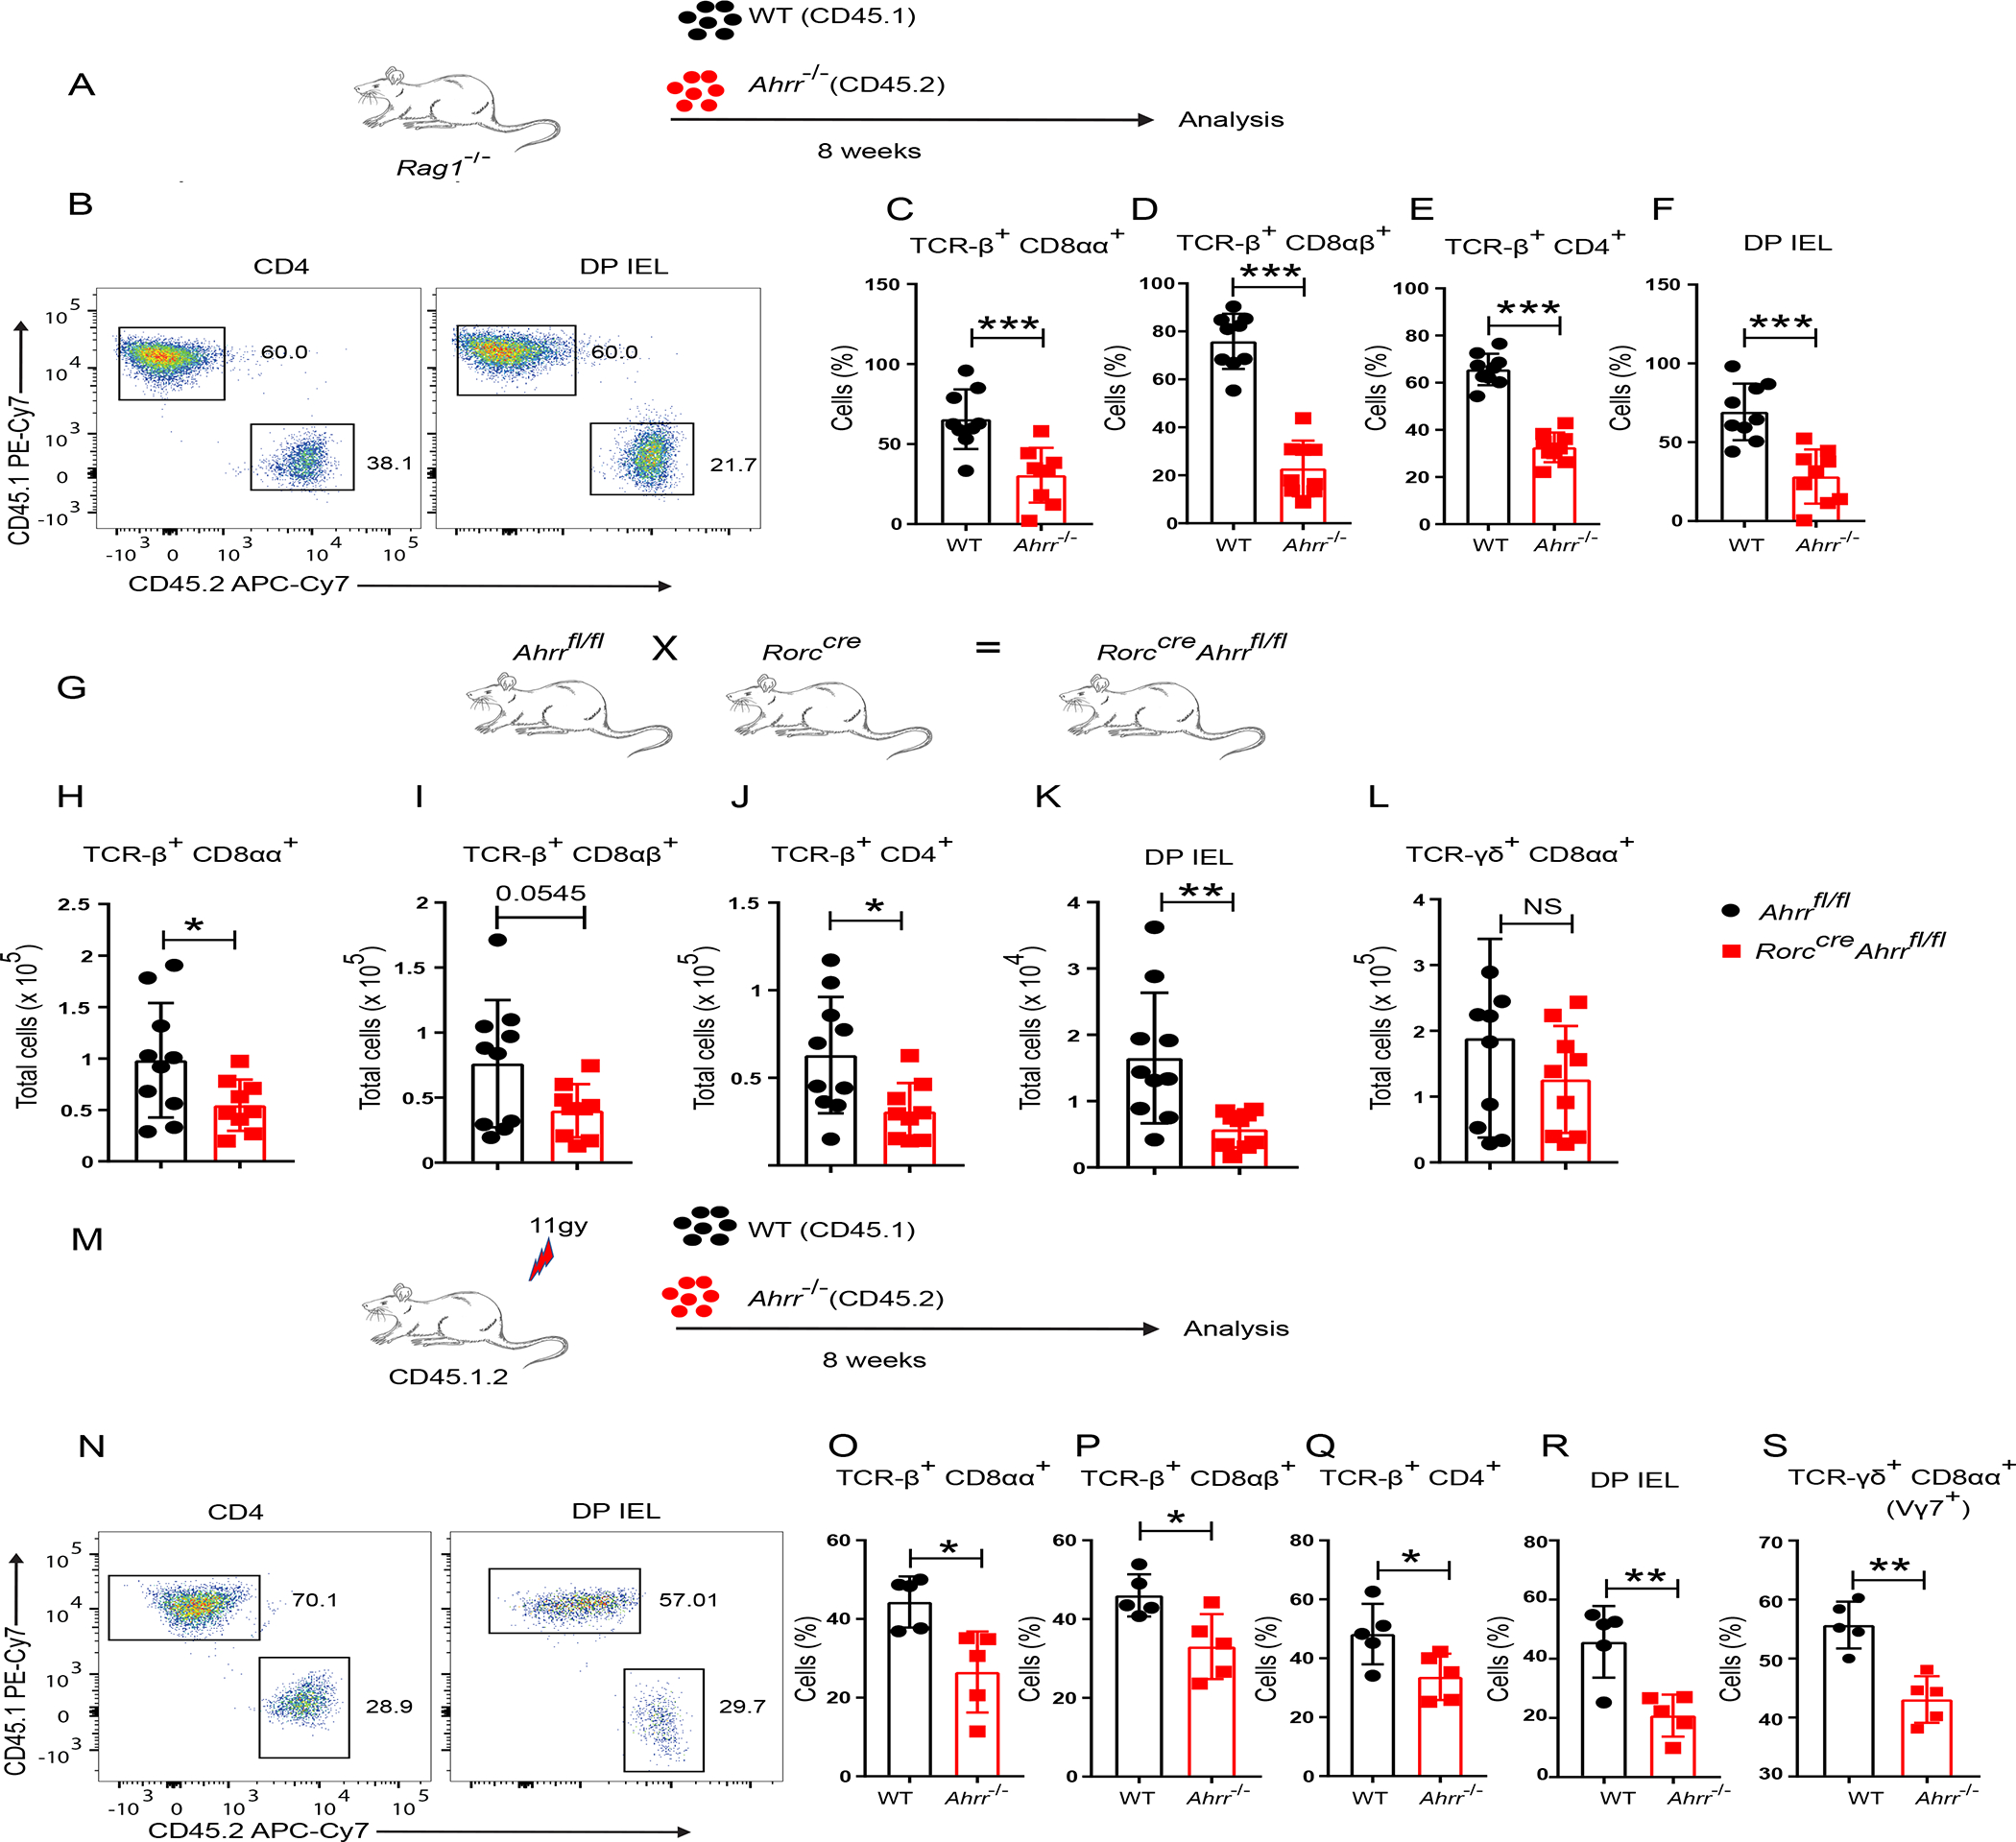
Figure 2. Loss of IEL in Ahrr−/− mice is cell intrinsic.

(A) Schematic of the experiment. Purified splenic T cells from WT (CD45.1) and Ahrr−/− (CD45.2) were transferred to Rag1−/− mice in 1:1 ratio and IEL were analyzed after 8 weeks. (B) Representative flow cytometry plots plots showing CD4+ T cells and DP IEL from small intestine of reconstituted mice. (C-F) Frequency of WT and Ahrr−/− TCR-β+ CD8αα+ (C), TCR-β+ CD8αβ+ (D), TCR-β+ CD4+ (E), and DP IEL (F), in the small intestine IEL of Rag1−/− mice after reconstitution. (G) Rorccre Ahrrfl/fl mice were generated by mating Rorccre with Ahrrfl/fl mice. (H-L) Cell numbers of TCR-β+ CD8αα+ (H), TCR-β+ CD8αβ+ (I), TCR-β+ CD4+ (J), DP IEL (K), and TCR-γδ+ CD8αα+ (L), in Ahrrfl/fl and Rorccre Ahrrfl/fl mice. (M) Schematic of the experiment: IEL from the small intestine of chimeric mice reconstituted with bone marrow cells from WT (CD45.1) and Ahrr−/− (CD45.2) mice in 1:1 ratio. (N) Representative flow cytometry plots showing CD4+ T cells and DP IEL from small intestine of reconstituted mice. o-s, Frequencies of WT and Ahrr−/− TCR-β+ CD8αα+ (O); TCR-β+ CD8 αβ+ (P), TCR-β+ CD4+ (Q), DP IEL (R), and γδ (vγ7+) IEL (S), in small intestinal epithelium of bone marrow chimeric mice. Each dot represents an individual mouse. Data are pool or representative of 2 individual experiments. Statistical significance was determined by Mann-Whitney test. *P<0.05, **P<0.01, ***P<0.001. Please also see Figure S3.
