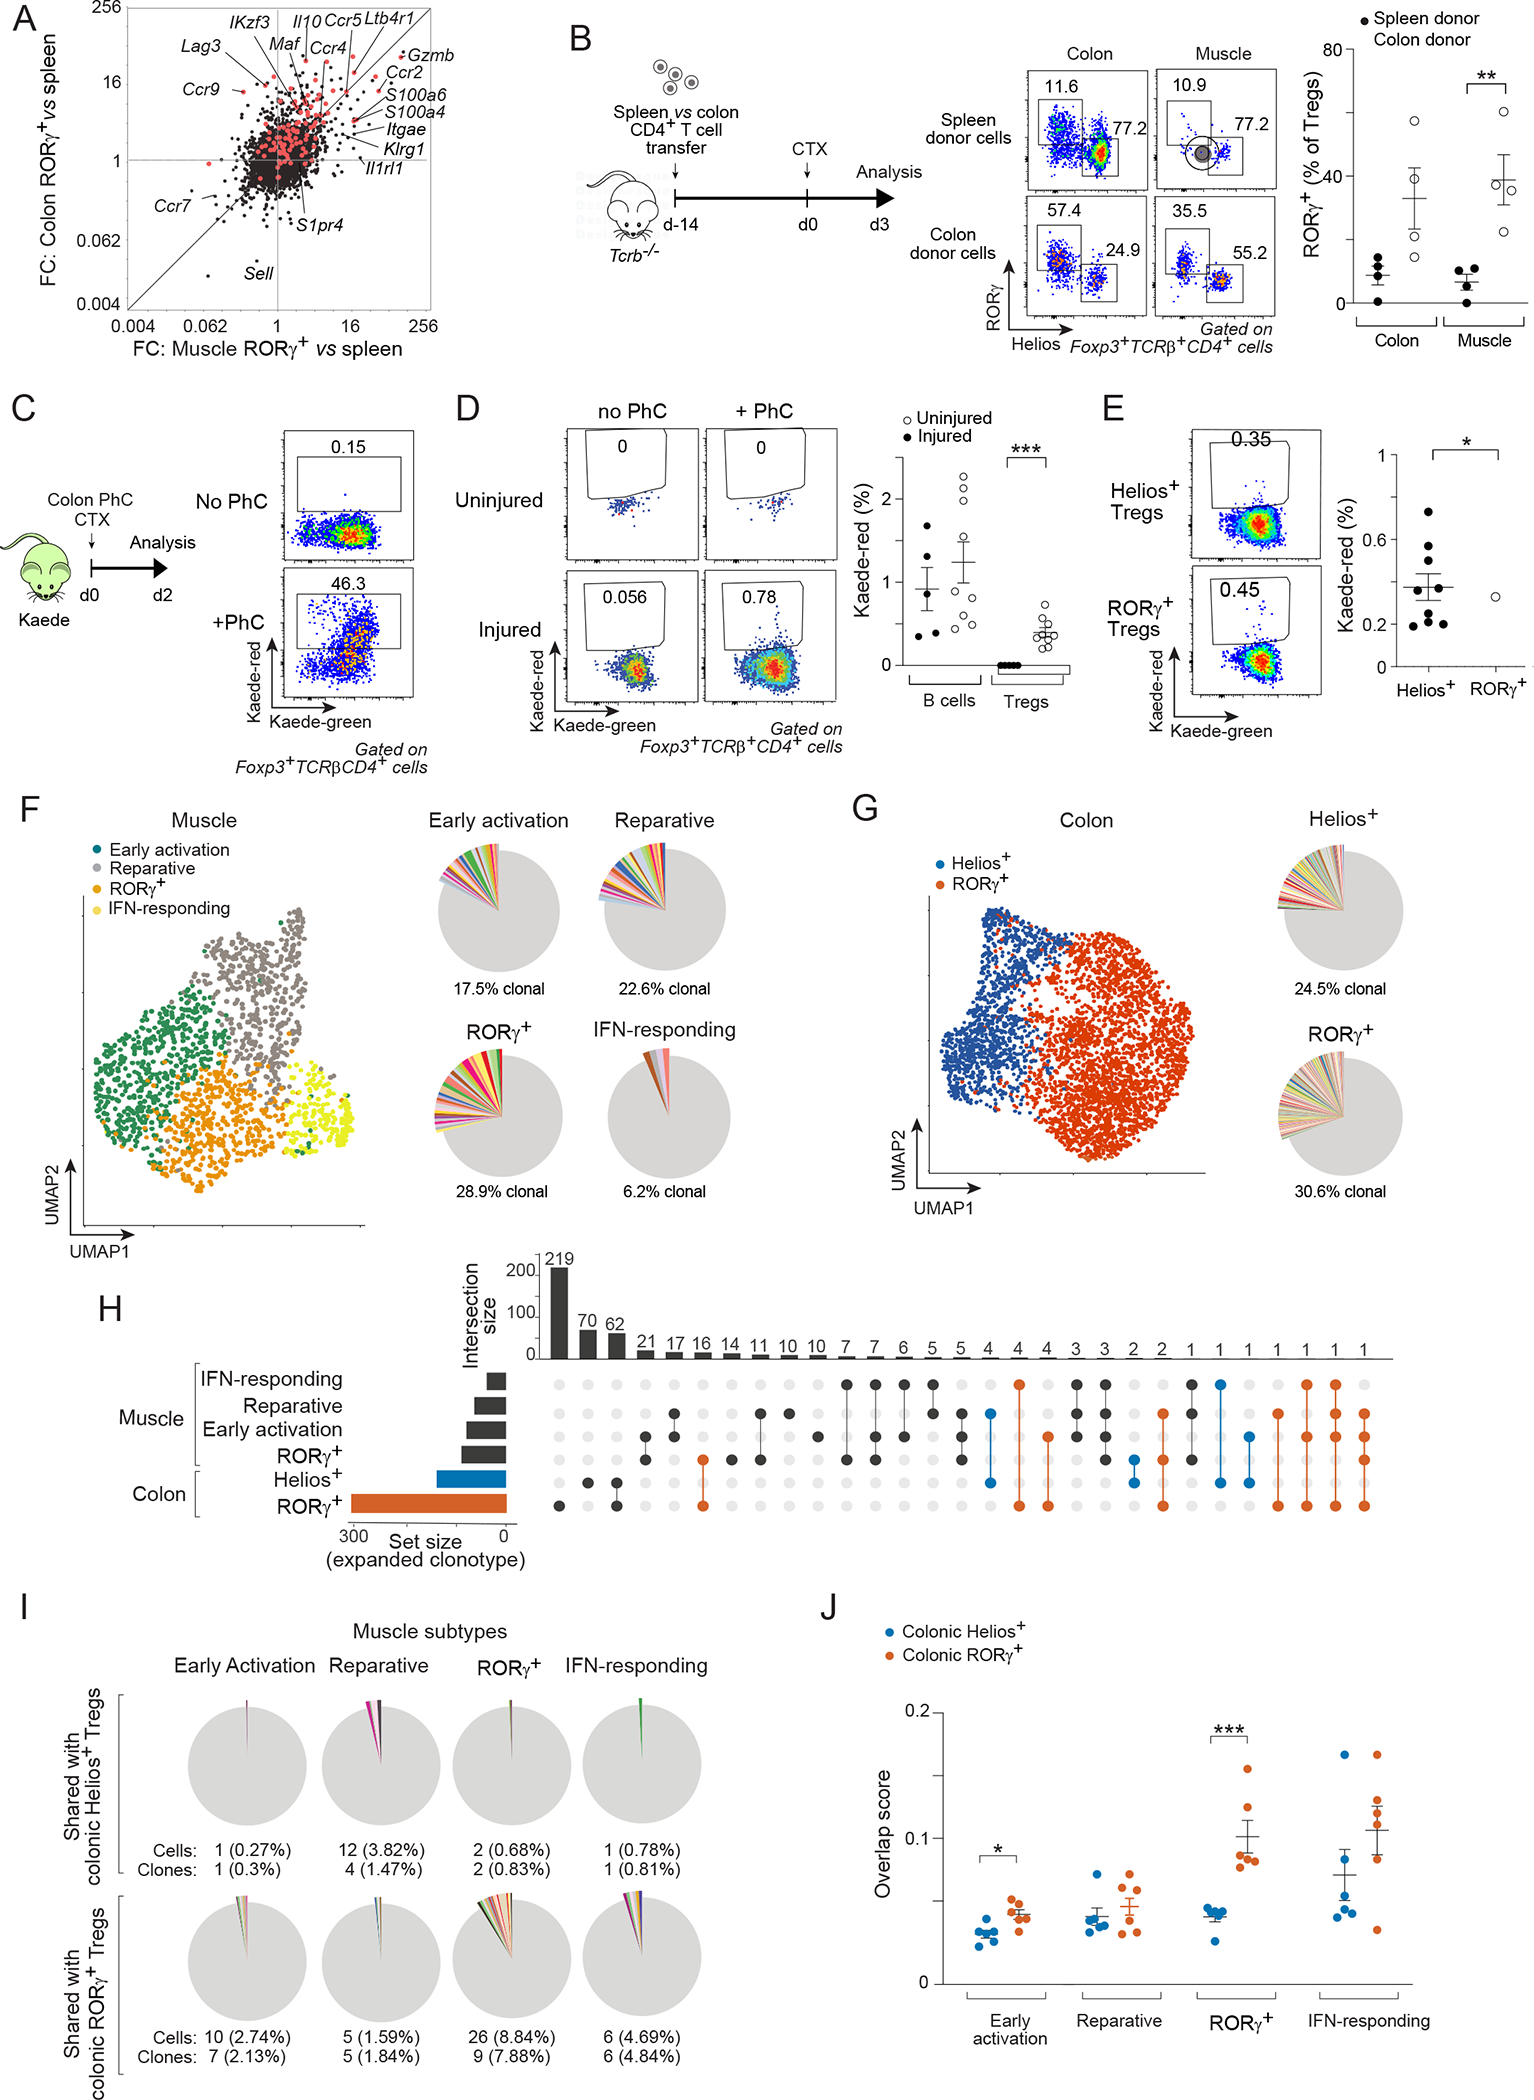
Figure 2: A colonic provenance for muscle RORγ+ Treg cells.

(A) Transcriptomic fold-change/fold-change (FC) plots comparing muscle RORγ+ vs spleen Treg cells at day 4 after CTX-induced injury vis-a-vis colon RORγ+ vs spleen Treg cells. Red: colonic RORγ+ Treg up-signature. (B) Spleen or colon CD4+ T cells were transferred into Tcrb−/− mice followed by CTX injection. Experimental design (left), representative dot-plots (middle), and summary data (right) of RORγ+ Treg cells in colon and muscle. (C-E) Colonic photoconversion (PhC) of Kaede mice ± CTX-induced injury. C) Experimental design (left) and representative dot-plots (right) of colon PhC efficiency at day 0. D, E) emigration of the indicated colonic cells to hindlimb muscles after 48 hr. Representative dot-plots (left) and summary data (right). (F-J) Paired scRNA-seq and scTcr-seq of muscle and colon Treg cells on day 3 after CTX injection. F) Left: UMAP of muscle data; right: pie-charts of scTcr-seq data showing the proportion of clonally expanded cells in each cluster. Different colors depict individual clones; non-expanded clones in gray. G) Same as panel F for colon Treg cells. H) Upset plot of intra-organ and inter-muscle-colon clonotype sharing. Set size indicates total number of expanded clones for each subtype. On top, the total number of shared clones is displayed. Incidences of clone sharing between any muscle Treg subtype and colonic RORγ+ (red) or Helios+ (blue) Treg cells are highlighted. I) Pie-charts depicting numbers and frequencies of clonotypes shared between muscle Treg cell subtypes and colonic RORγ+ or Helios+ Treg cells. Different colors depict individual clones; non-expanded clones in gray. J) Clonal overlap score between muscle Treg subtypes and colonic RORγ+ vs Helios+ Treg cells in individual mice. Representative dot-plots are from 2–3 independent experiments. Unpaired t-test (B, D), paired t-test (E), or two-way ANOVA (J). See also Figure S2.
