
Figure 3: Mechanisms of RORγ+ Treg cell accumulation in regenerating muscle.
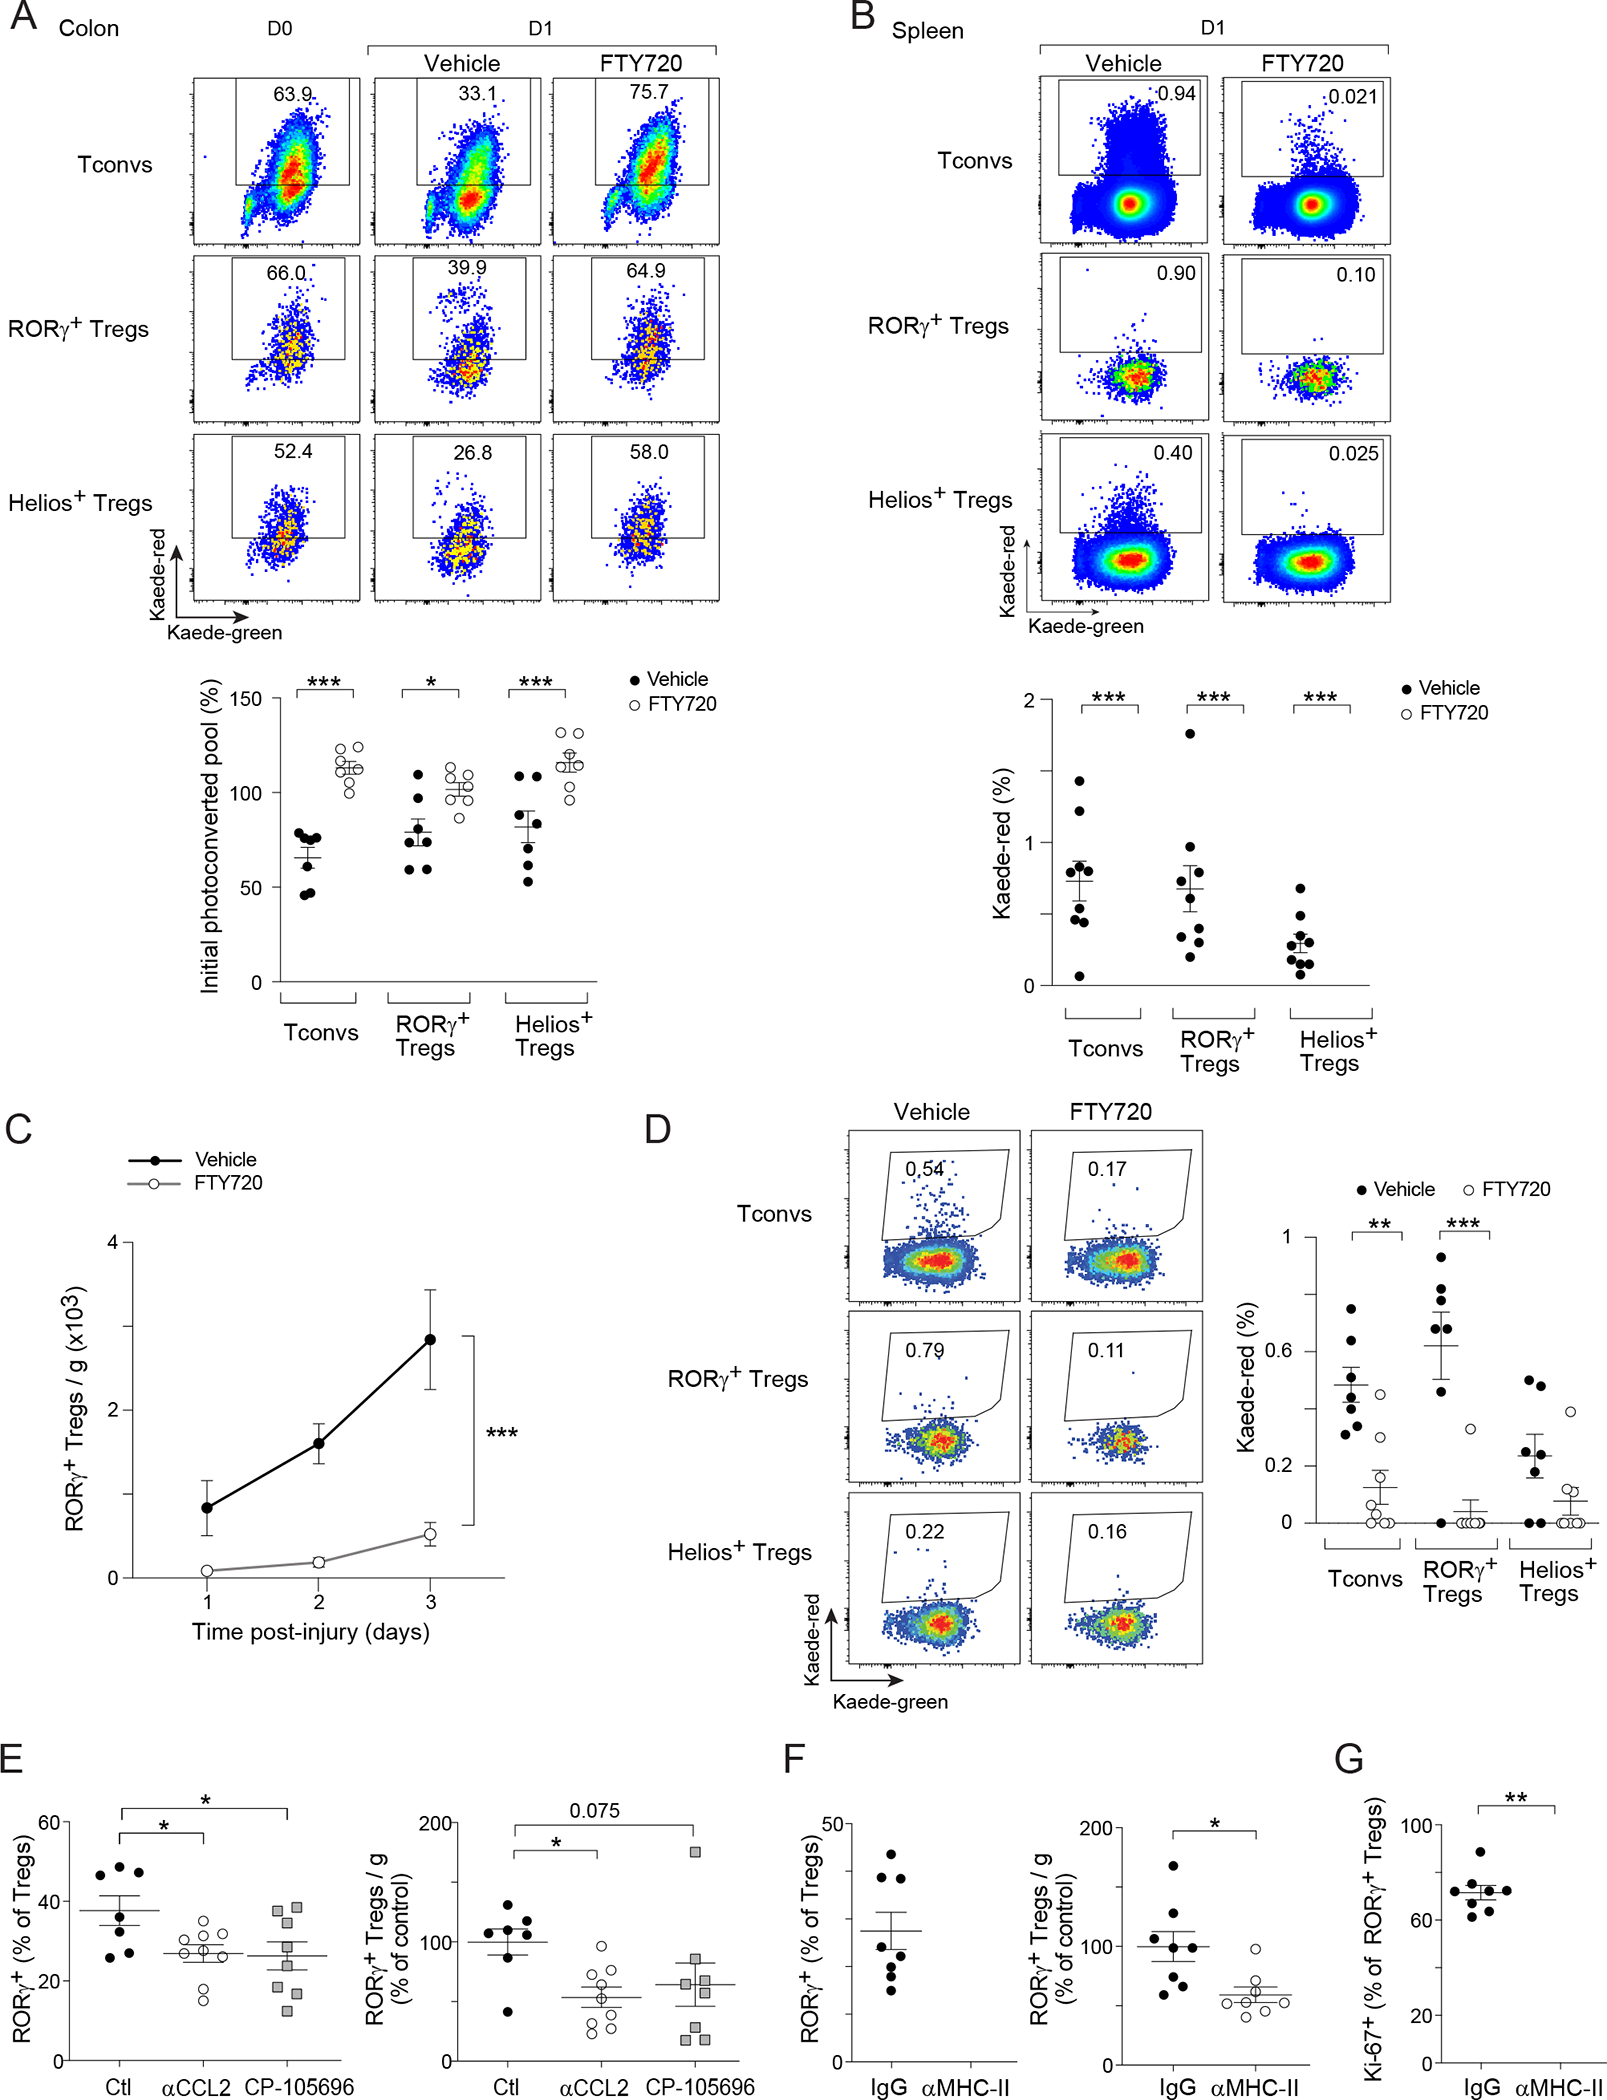
(A) Egress of diverse lymphocyte populations from the colon, and (B) their emigration to spleen after 24 hr of colonic PhC of Kaede mice. Top: representative dot-plots; bottom: summary data. (C) Muscle RORγ+ Treg cell numbers after CTX-induced injury in vehicle- or FTY720-treated mice. (D) Colon PhC coupled with CTX-induced injury as per Figure 2C. Representative dot-plots (left) and summary data (right) of emigration of colonic cells to hindlimb muscles after 48 hr. (E) RORγ+ Treg cell fraction (left) and number (right) in hindlimb muscles 2 days after CTX-induced injury in in control- (Ctl), αCCL2-, or CP-105696-treated mice. (F, G) Mice were treated with isotype (IgG) or αMHC-II antibody. F) Muscle RORγ+ Treg cell fraction (left) and number (right), and G) Ki-67 expression 3 days after CTX-induced injury. Representative dot-plots are from 2–3 independent experiments. Unpaired t-test (A, B, F, G), two-way ANOVA (C), or one-way ANOVA (E). See also Figure S3.