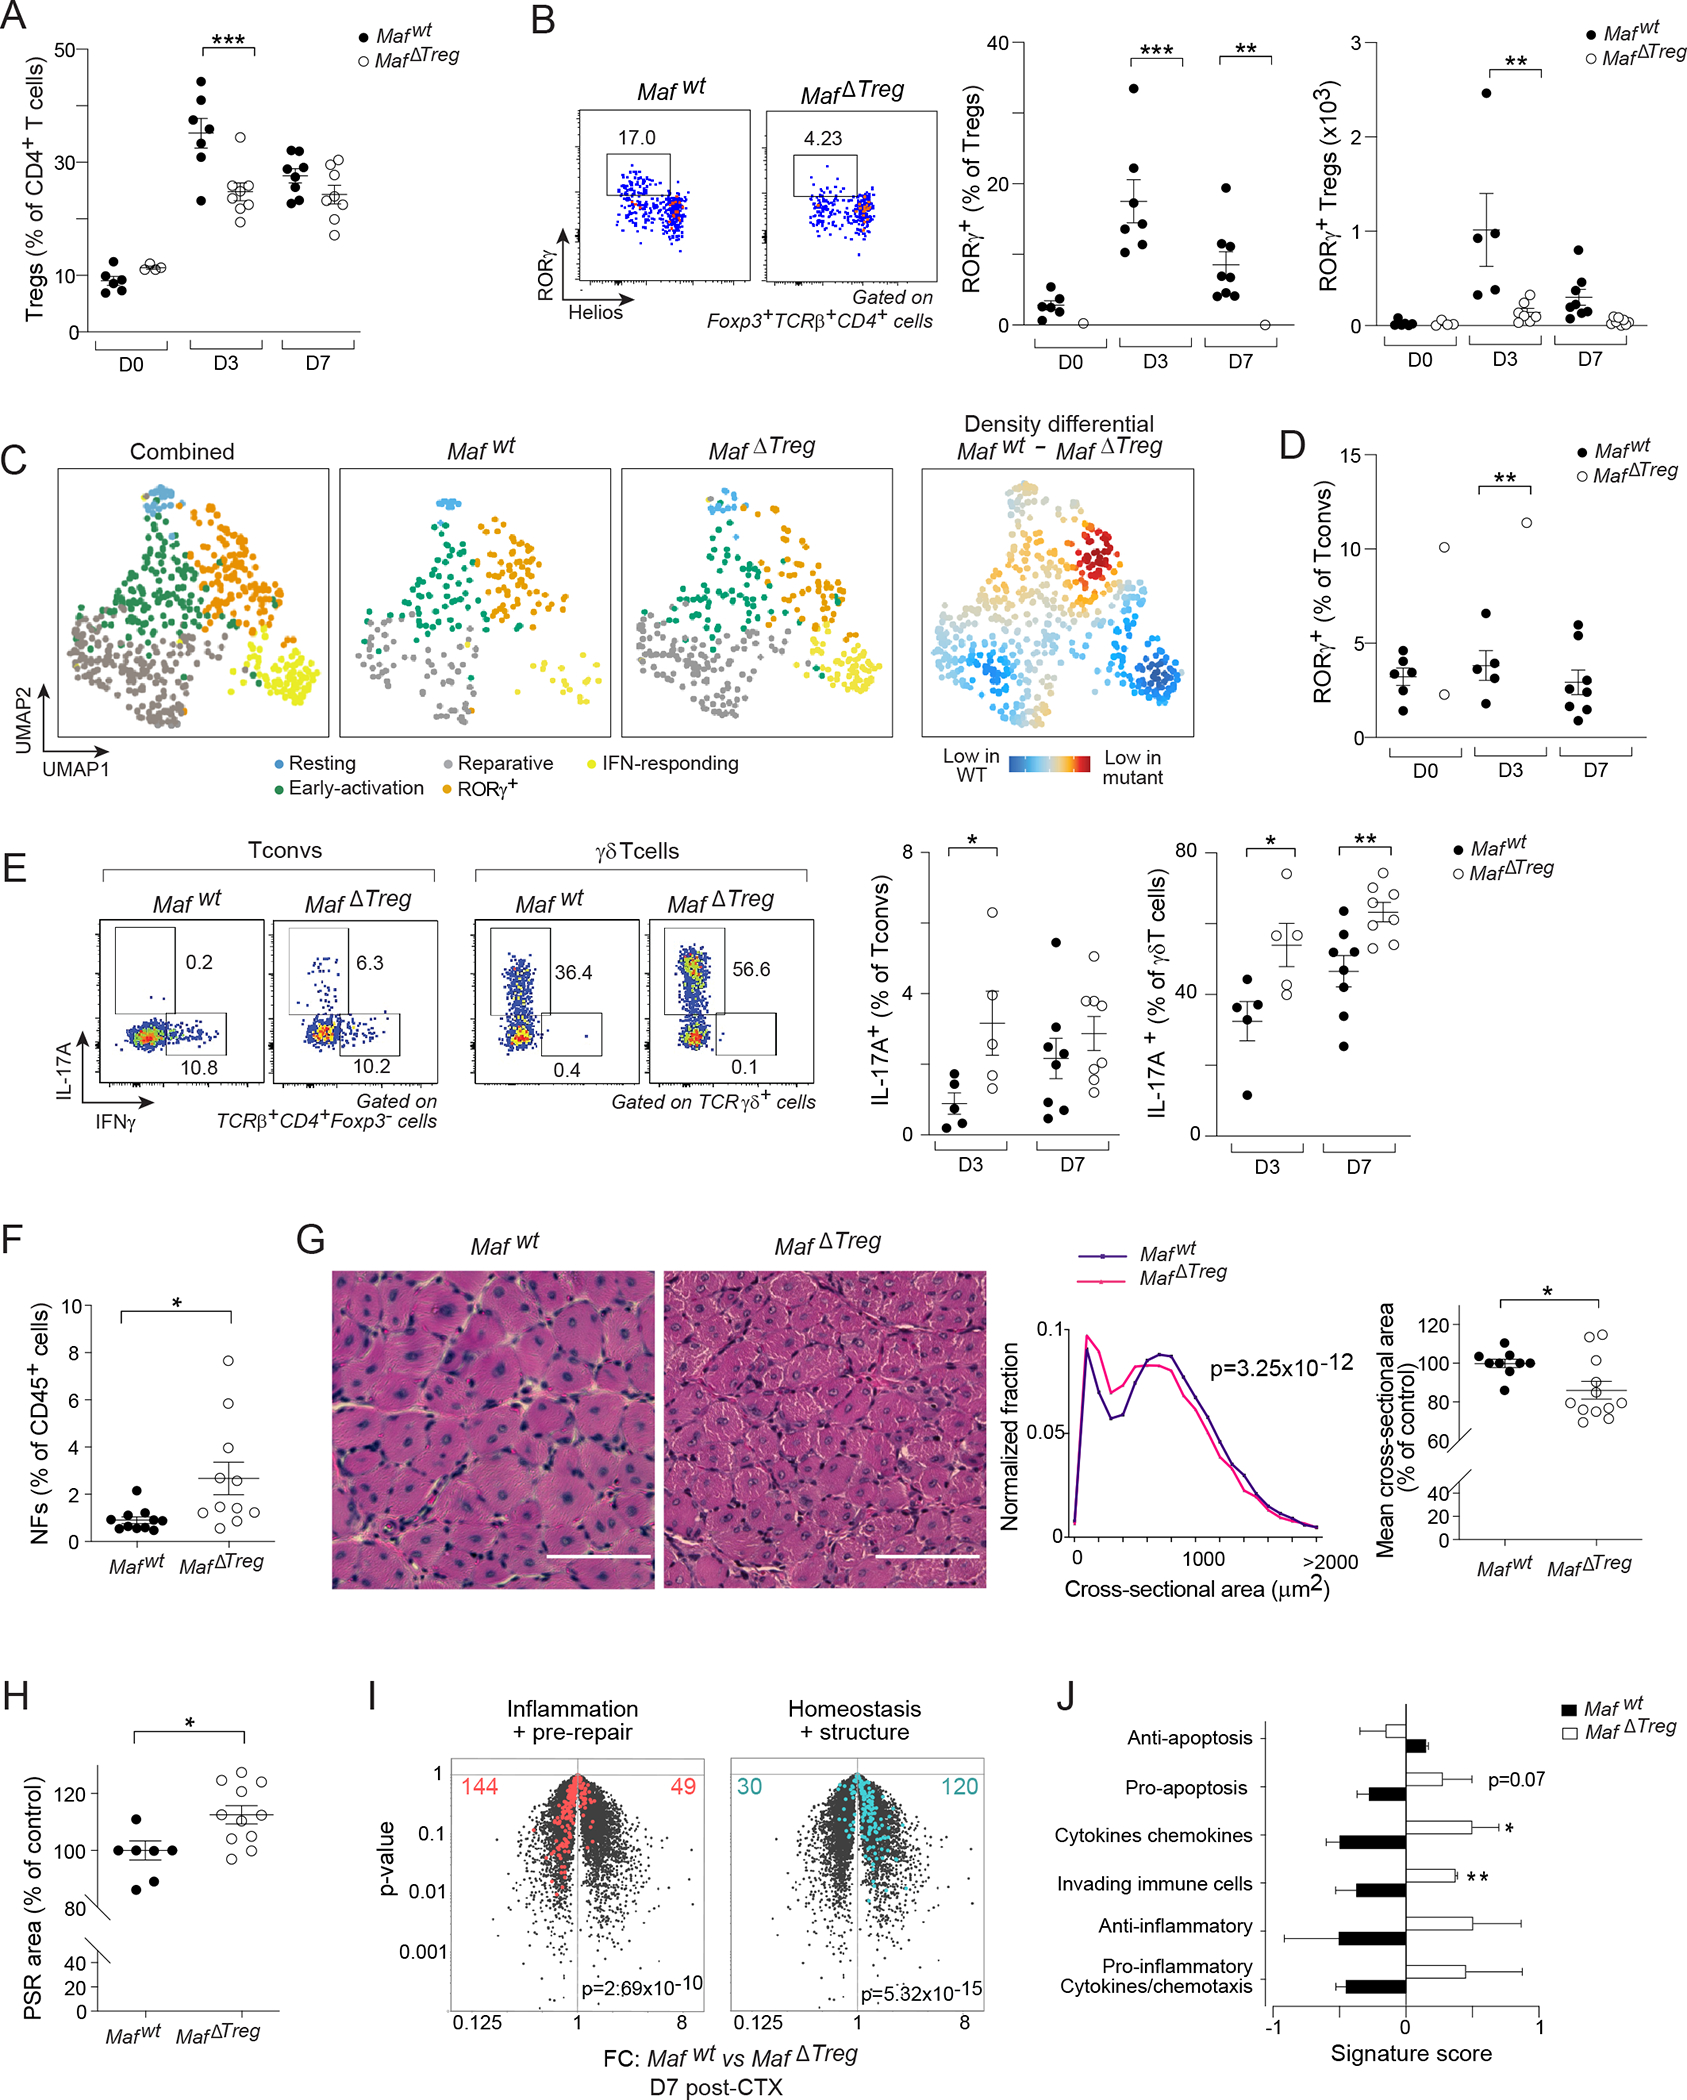
Figure 5: Impacts of RORγ+ Treg cell depletion on immunocytes and tissue repair.

Comparisons of hindlimb muscles from Mafwt and MafΔTreg littermates 0, 3, or 7 days after CTX-induced injury. Quantification of (A) Total, and B) RORγ+ Treg cells. (C) scRNA-seq of muscle Treg cells 3 days after CTX-induced injury. 2D UMAP plot of combined data from the two genotypes (left); each individual condition (middle) and their differential (right). (D) Quantification of muscle RORγ+CD4+Foxp3− (Tconv) cells, and (E) production of IFNγ and IL-17A by Tconv and γδT cells. (F-J) Analysis of muscle repair efficiency 7 days after CTX-induced injury. F) Quantification of muscle neutrophils (NFs). G) Representative images of H&E staining (left); distribution of cross-sectional areas of individual centrally nucleated fibers (middle); average fiber areas for individual mice (right). H) Quantification of fibrotic areas via picrosirius red (PSR) staining. (I, J) Transcriptional analyses of whole muscle (n=3). I) Volcano plot illustrating FC differences between the two genotypes. Repair-related signatures43 are highlighted. J) Gene-signature scores of inflammatory gene sets44. Representative dot-plots and images are from 2–4 independent experiments. t-test of weighted sums (G middle), Chi-squared test (I), otherwise unpaired t-test. See also Figure S5.
