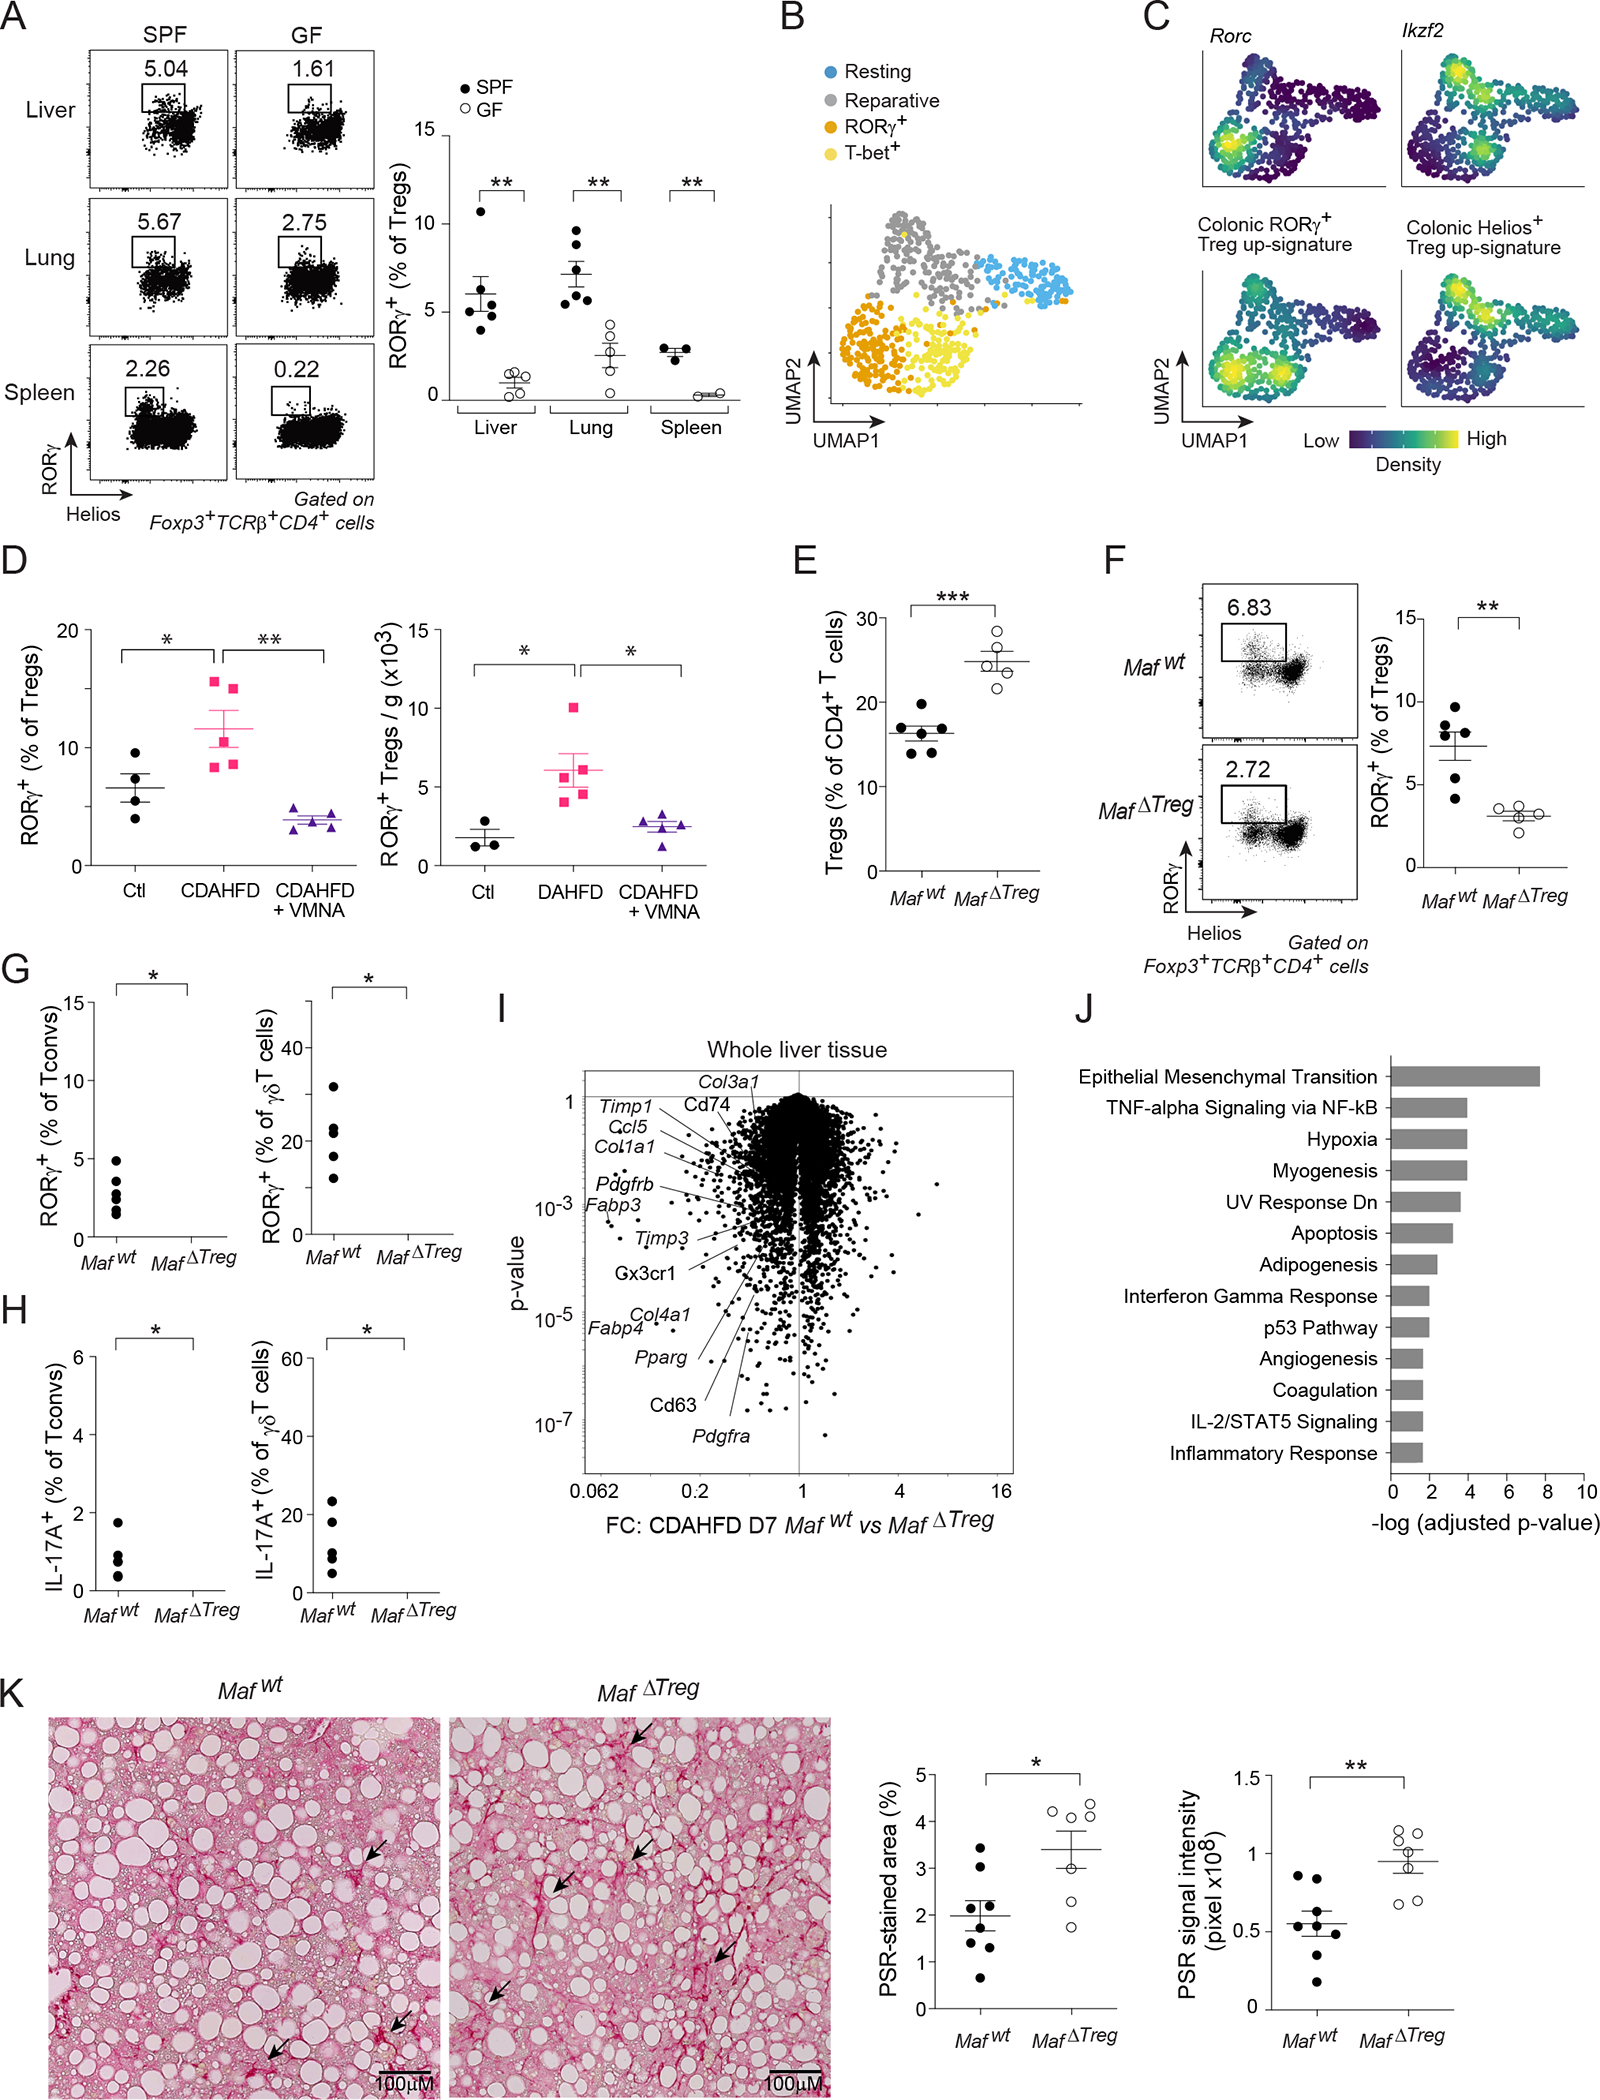
Figure 7: Generality of RORγ+ Treg cells’ role in regulating tissue inflammation.

(A) RORγ+ Treg cell fractions in diverse tissues of SPF and GF mice. (B, C) scRNA-seq of cardiac muscle Treg cells after myocardial infarction57. B) 2D UMAP plot. C) Density plot of the indicated genes and signatures. (D) Quantification of liver RORγ+ Treg cells after one week of feeding with control diet (Ctl) or choline-deficient, L-amino acid-defined, high-fat diet (CDAHFD) ± VMNA treatment. (E-J) MafΔTreg or Mafwt mice were fed with CDAHFD for one week. Quantification of liver E) total Treg cells; F) RORγ+ Treg cells; G) RORγ+ Tconv (left) and γδT cells (right); and H) IL-17A expression. I) Volcano plot illustrating the transcriptional differences in livers from the two genotypes. J) Pathway analysis of transcripts significantly up-regulated ≥ 1.5-fold in MafΔTreg livers. (K) Mice were fed with CDAHFD for 8 weeks. Representative images (left) and summary data (right) of liver PSR staining. Representative dot-plots and images are from 2 independent experiments. Unpaired t-test (A, D-F, K), or paired t-test (G, H). See also Figure S7.
