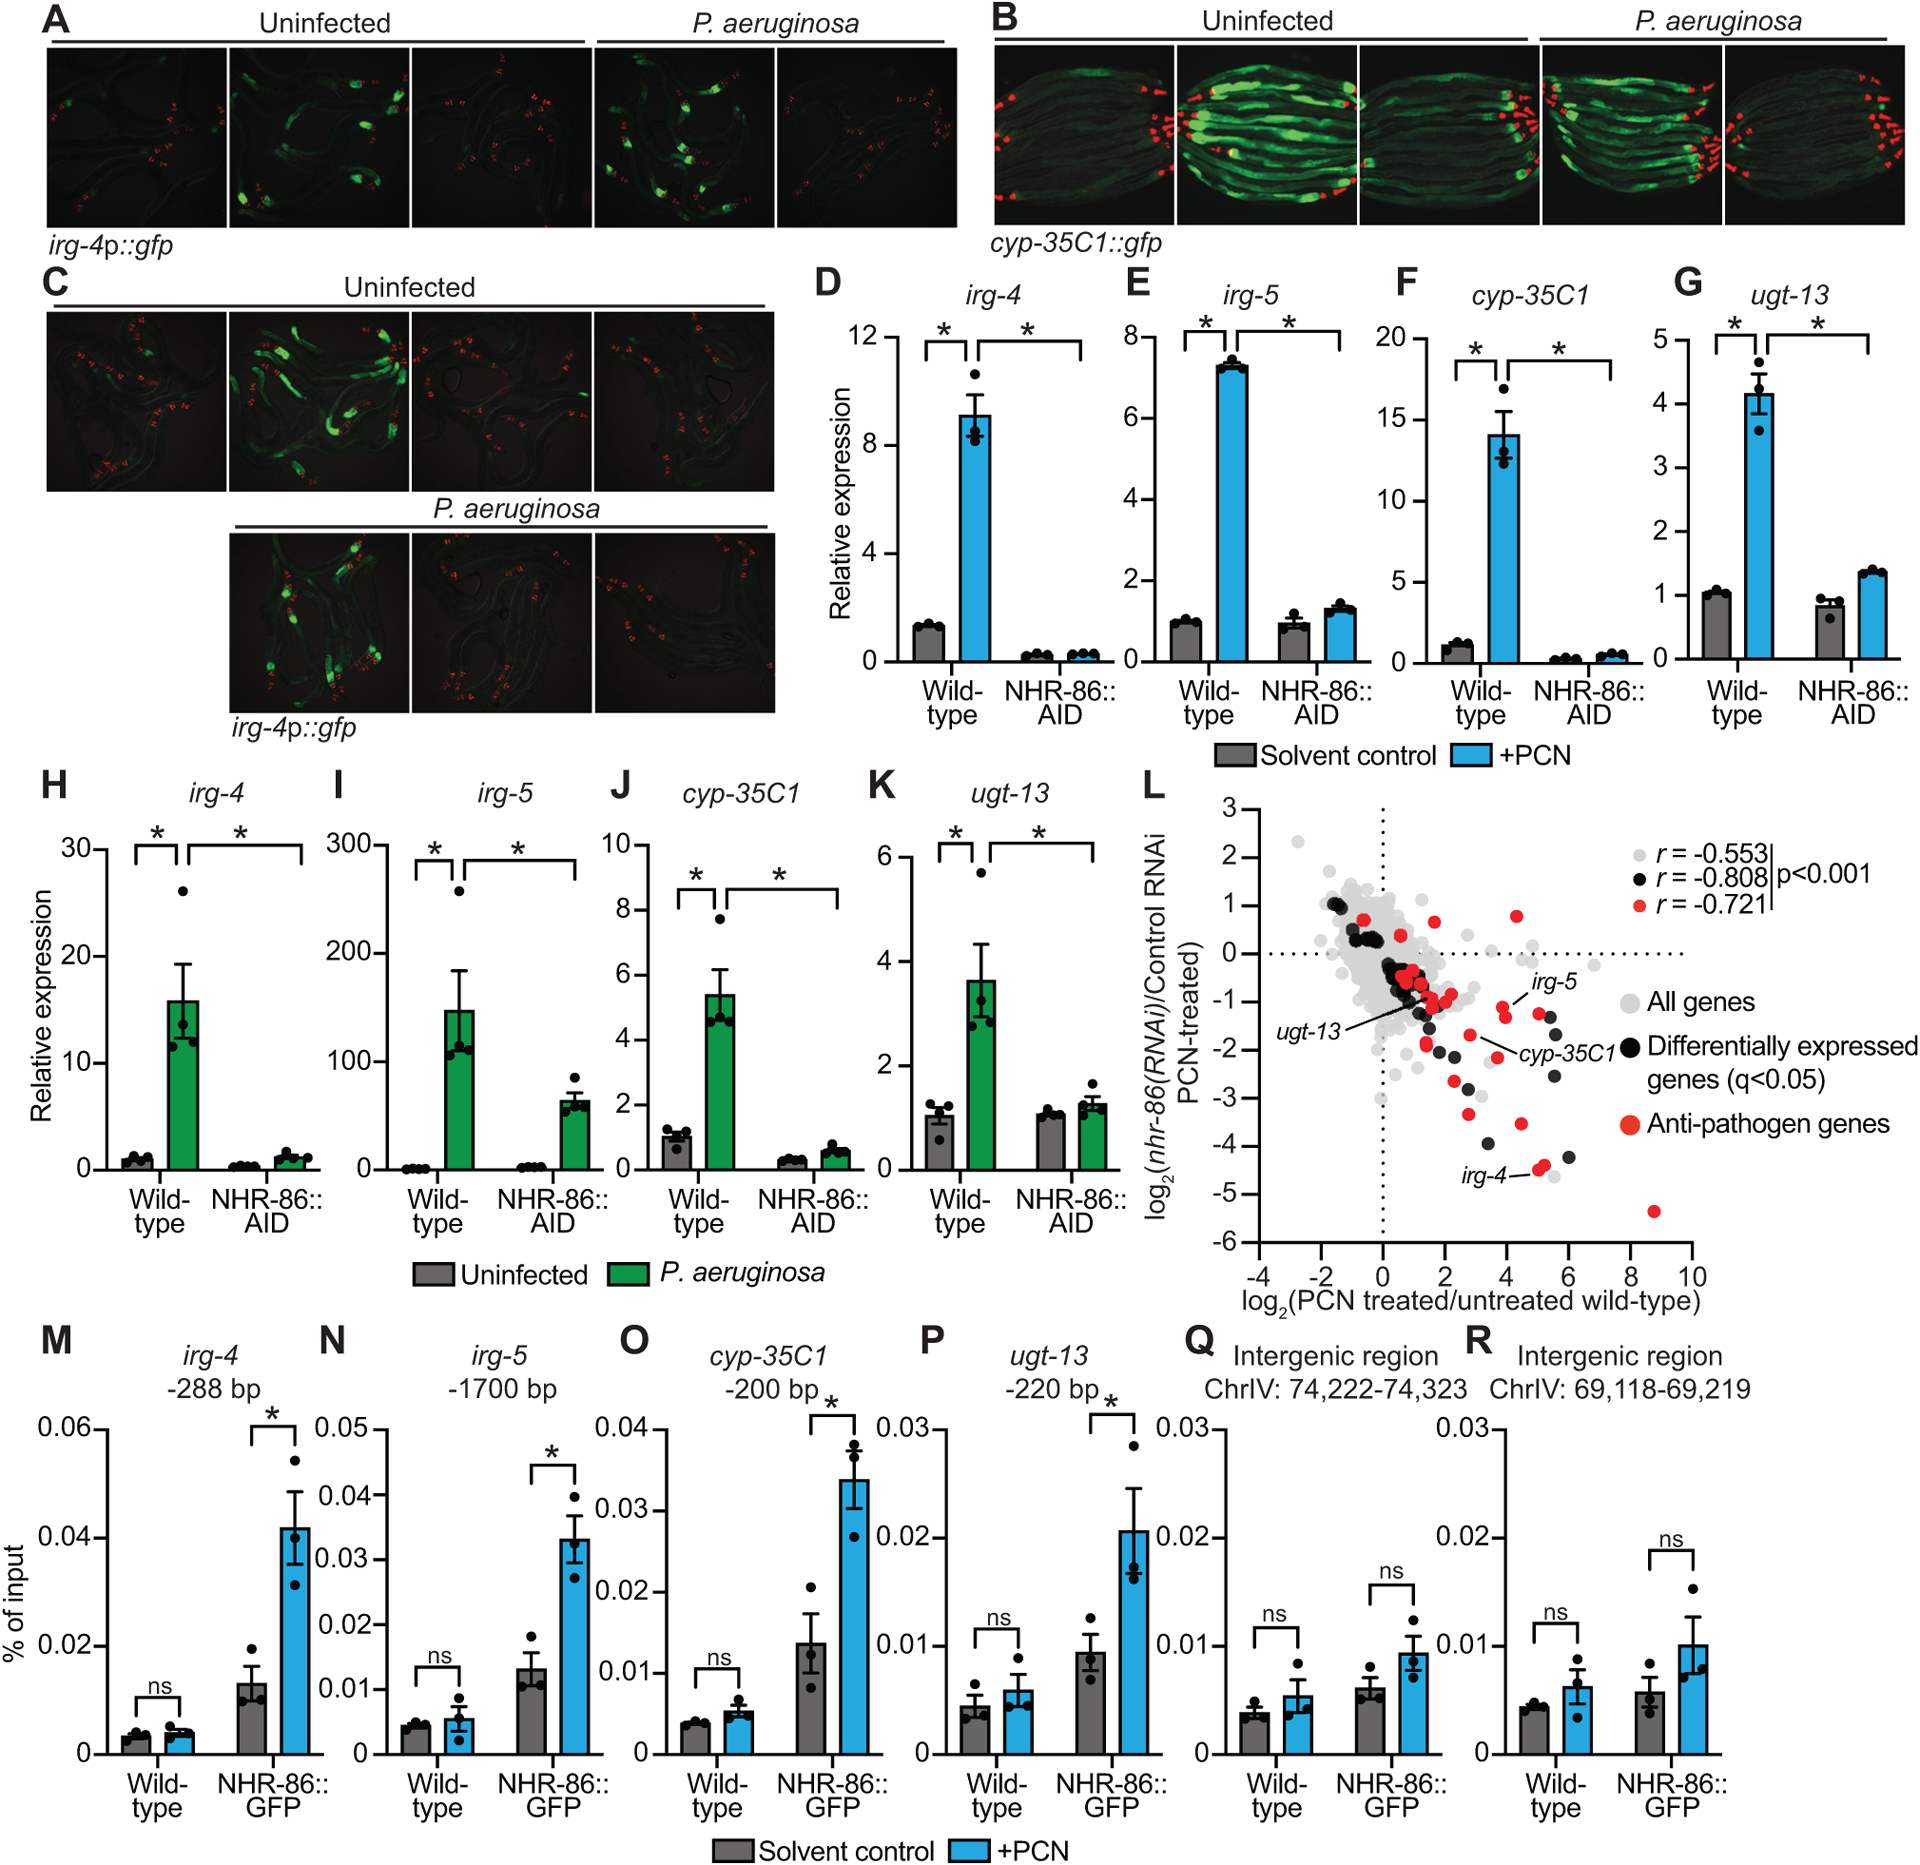
Figure 2. The anti-pathogen transcriptional program induced by PCN requires the C. elegans nuclear hormone receptor nhr-86.

(A and B) Images of C. elegans irg-4p∷gfp (A) and cyp-35C1∷gfp (B) transcriptional reporters with indicated RNAi conditions either exposed to PCN in the absence of infection or during P. aeruginosa infection, (scale bar, 200 μM). (C) Images of C. elegans irg-4p∷gfp transcriptional reporters with indicated genotypes and conditions, (scale bar, 200 μM). (D-K) qRT-PCR analysis of the indicated innate immune genes in wild-type and NHR-86∷AID animals exposed to either PCN in the absence of infection (n=3) (D-G) or during infection with P. aeruginosa (n=4) (H-K). All conditions are in the presence of auxin. Data are the mean of biological replicates with error bars giving SEM. *equals p<0.05 (two-way ANOVA with Tukey’s multiple comparisons test) (L) Data from mRNA-sequencing experiments comparing genes differentially regulated in nhr-86(RNAi) versus control RNAi-treated animals exposed to PCN (y-axis) are compared with genes differentially expressed in wild-type animals exposed to PCN (x-axis). All genes are shown in gray. Genes that are differentially expressed in both datasets are shown in black (q<0.05), and the differentially expressed genes annotated as anti-pathogen genes (innate immune effector or detoxification genes) are shown in red. The Pearson correlation coefficient (r) between the indicated transcriptional signatures is shown. The location of the genes irg-4, irg-5, cyp-35C1, and ugt-13, whose regulation is examined throughout this manuscript, are shown. (n=3) See also Table S1C. (M-R) ChIP-qPCR analysis of NHR-86 binding to the indicated DNA regions in wild-type and NHR-86∷GFP animals exposed to solvent control or PCN. Protein-DNA complexes were immunoprecipitated with a α-GFP antibody. Data are the mean of biological replicates with error bars giving SEM (n=3). *equals p<0.05 (two-way ANOVA with Tukey’s multiple comparisons test). Source data for this figure is in Table S3. See also Fig. S2.
