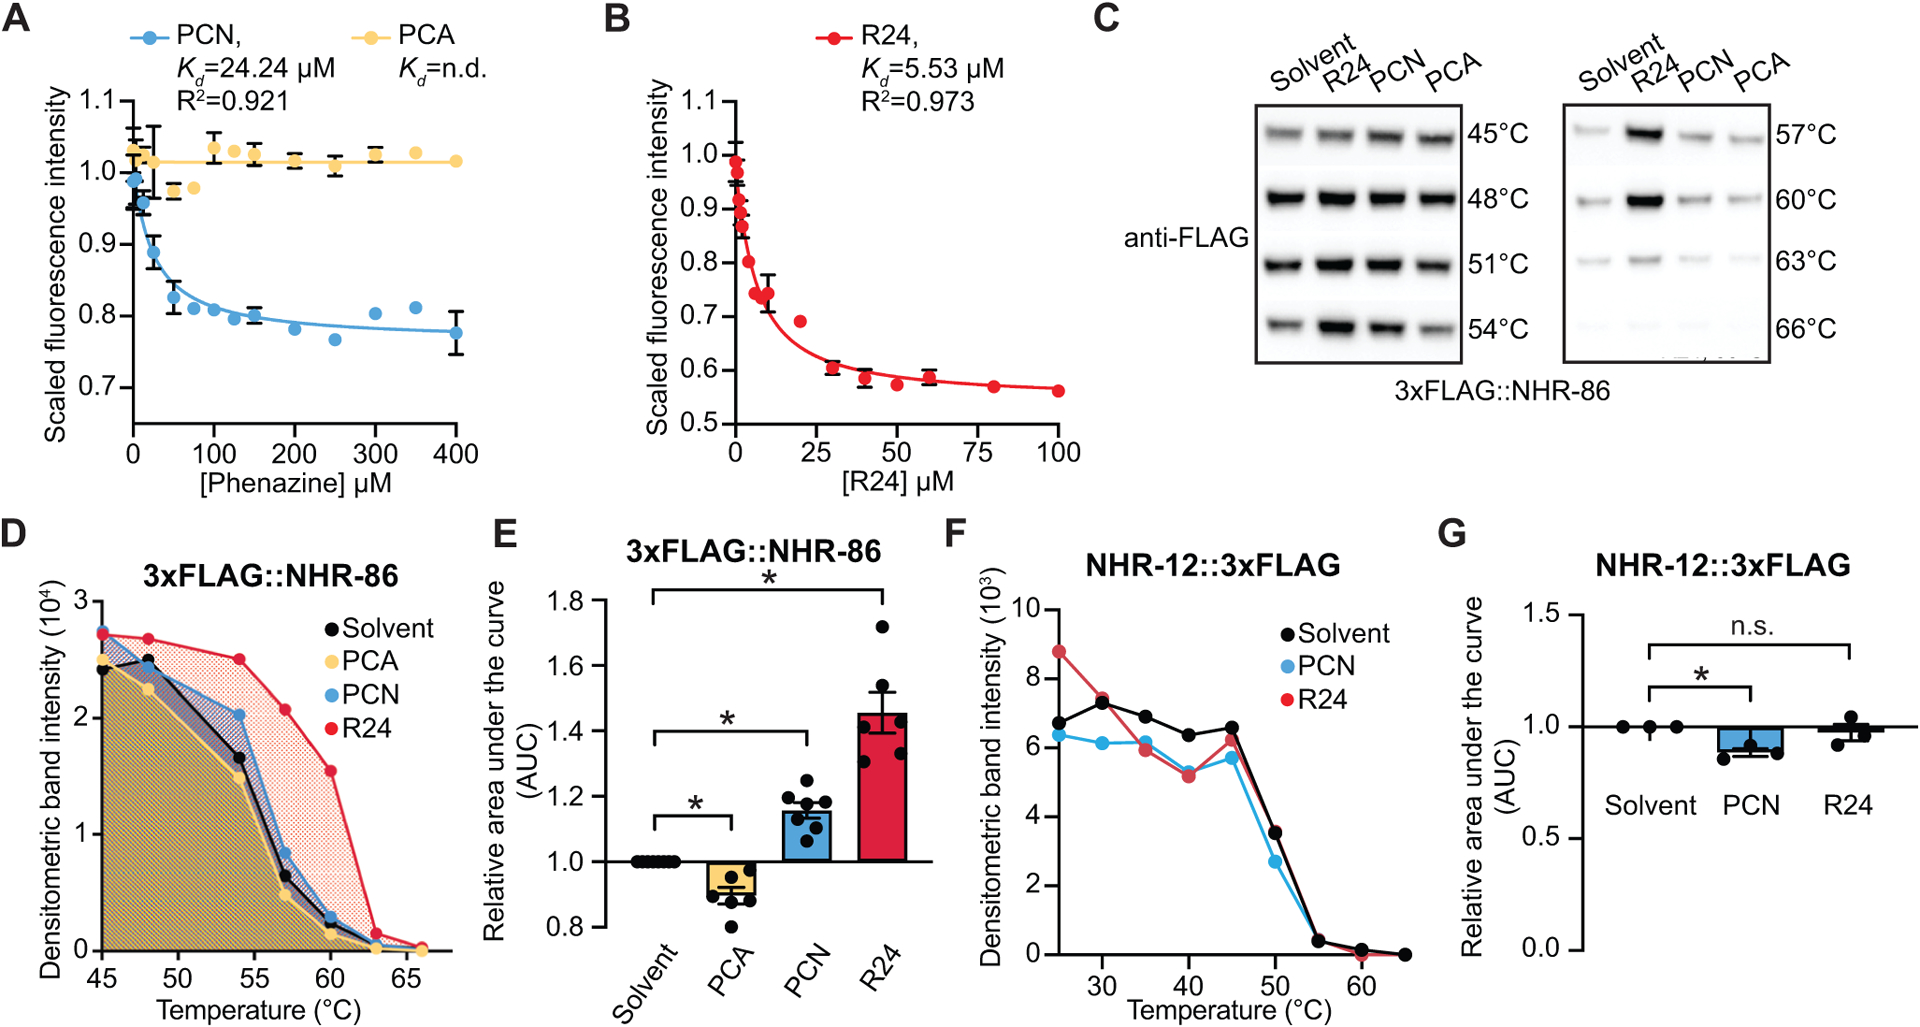
Figure 3. The bacterial metabolite PCN and synthetic immunostimulatory molecule R24 bind to the ligand-binding domain of NHR-86.

(A and B) Intrinsic tryptophan fluorescence intensity of the purified ligand-binding domain (LBD) of NHR-86 treated with the indicated concentrations of PCN (A), PCA (A), and R24 (B), each normalized to the solvent control-treated samples. Curves represent a non-linear regression fit of the scaled fluorescence intensity data points for each condition. An equilibrium dissociation constant (Kd) and goodness of fit calculation (R2) are shown for each curve. Data in (A) and (B) are the average of biological replicate samples (n=3) with error bars giving SEM. SDS-PAGE analysis of purified NHR(LBD) is shown in Fig. S3A. (C) A representative immunoblot of a cellular thermal shift assay (CETSA) experiment using an anti-FLAG antibody that probed whole cell lysates from a transgenic C. elegans strain in which NHR-86 was tagged with 3xFLAG at its endogenous locus. (D) A representative densitometric quantification from a CETSA experiment that characterized the interaction of PCN (400–500 μM) (n=7), PCA (400–500 μM) (n=6), and R24 (70 μM) (n=6) with 3xFLAG∷NHR-86. (E) The area under the curve was quantified from each biological replicate experiment for the experiment described in (D) and normalized to the solvent control condition. All biological replicates for this experiment are shown in Fig. S3B. (F) Quantification of NHR-12∷3xFLAG immunoblot band intensities for each treatment condition and temperature from a representative experiment. (G) The area under the curve was quantified from each biological replicate for the experiment described in (F) and normalized to the solvent control condition (n=3). All biological replicates for this experiment are shown in Fig. S3C. Data in (E) and (G) are the average of all biological replicates with error bars giving SEM. *equals p<0.05 (two-tailed, unpaired t-test with Welch’s correction). The structures of R24, PCN and PCA are show in Fig. S3D. Source data for this figure is in Table S3. See also Fig. S3.
