
Figure 4. The phenylalanine at position 379 of NHR-86 is required for binding of PCN and R24.
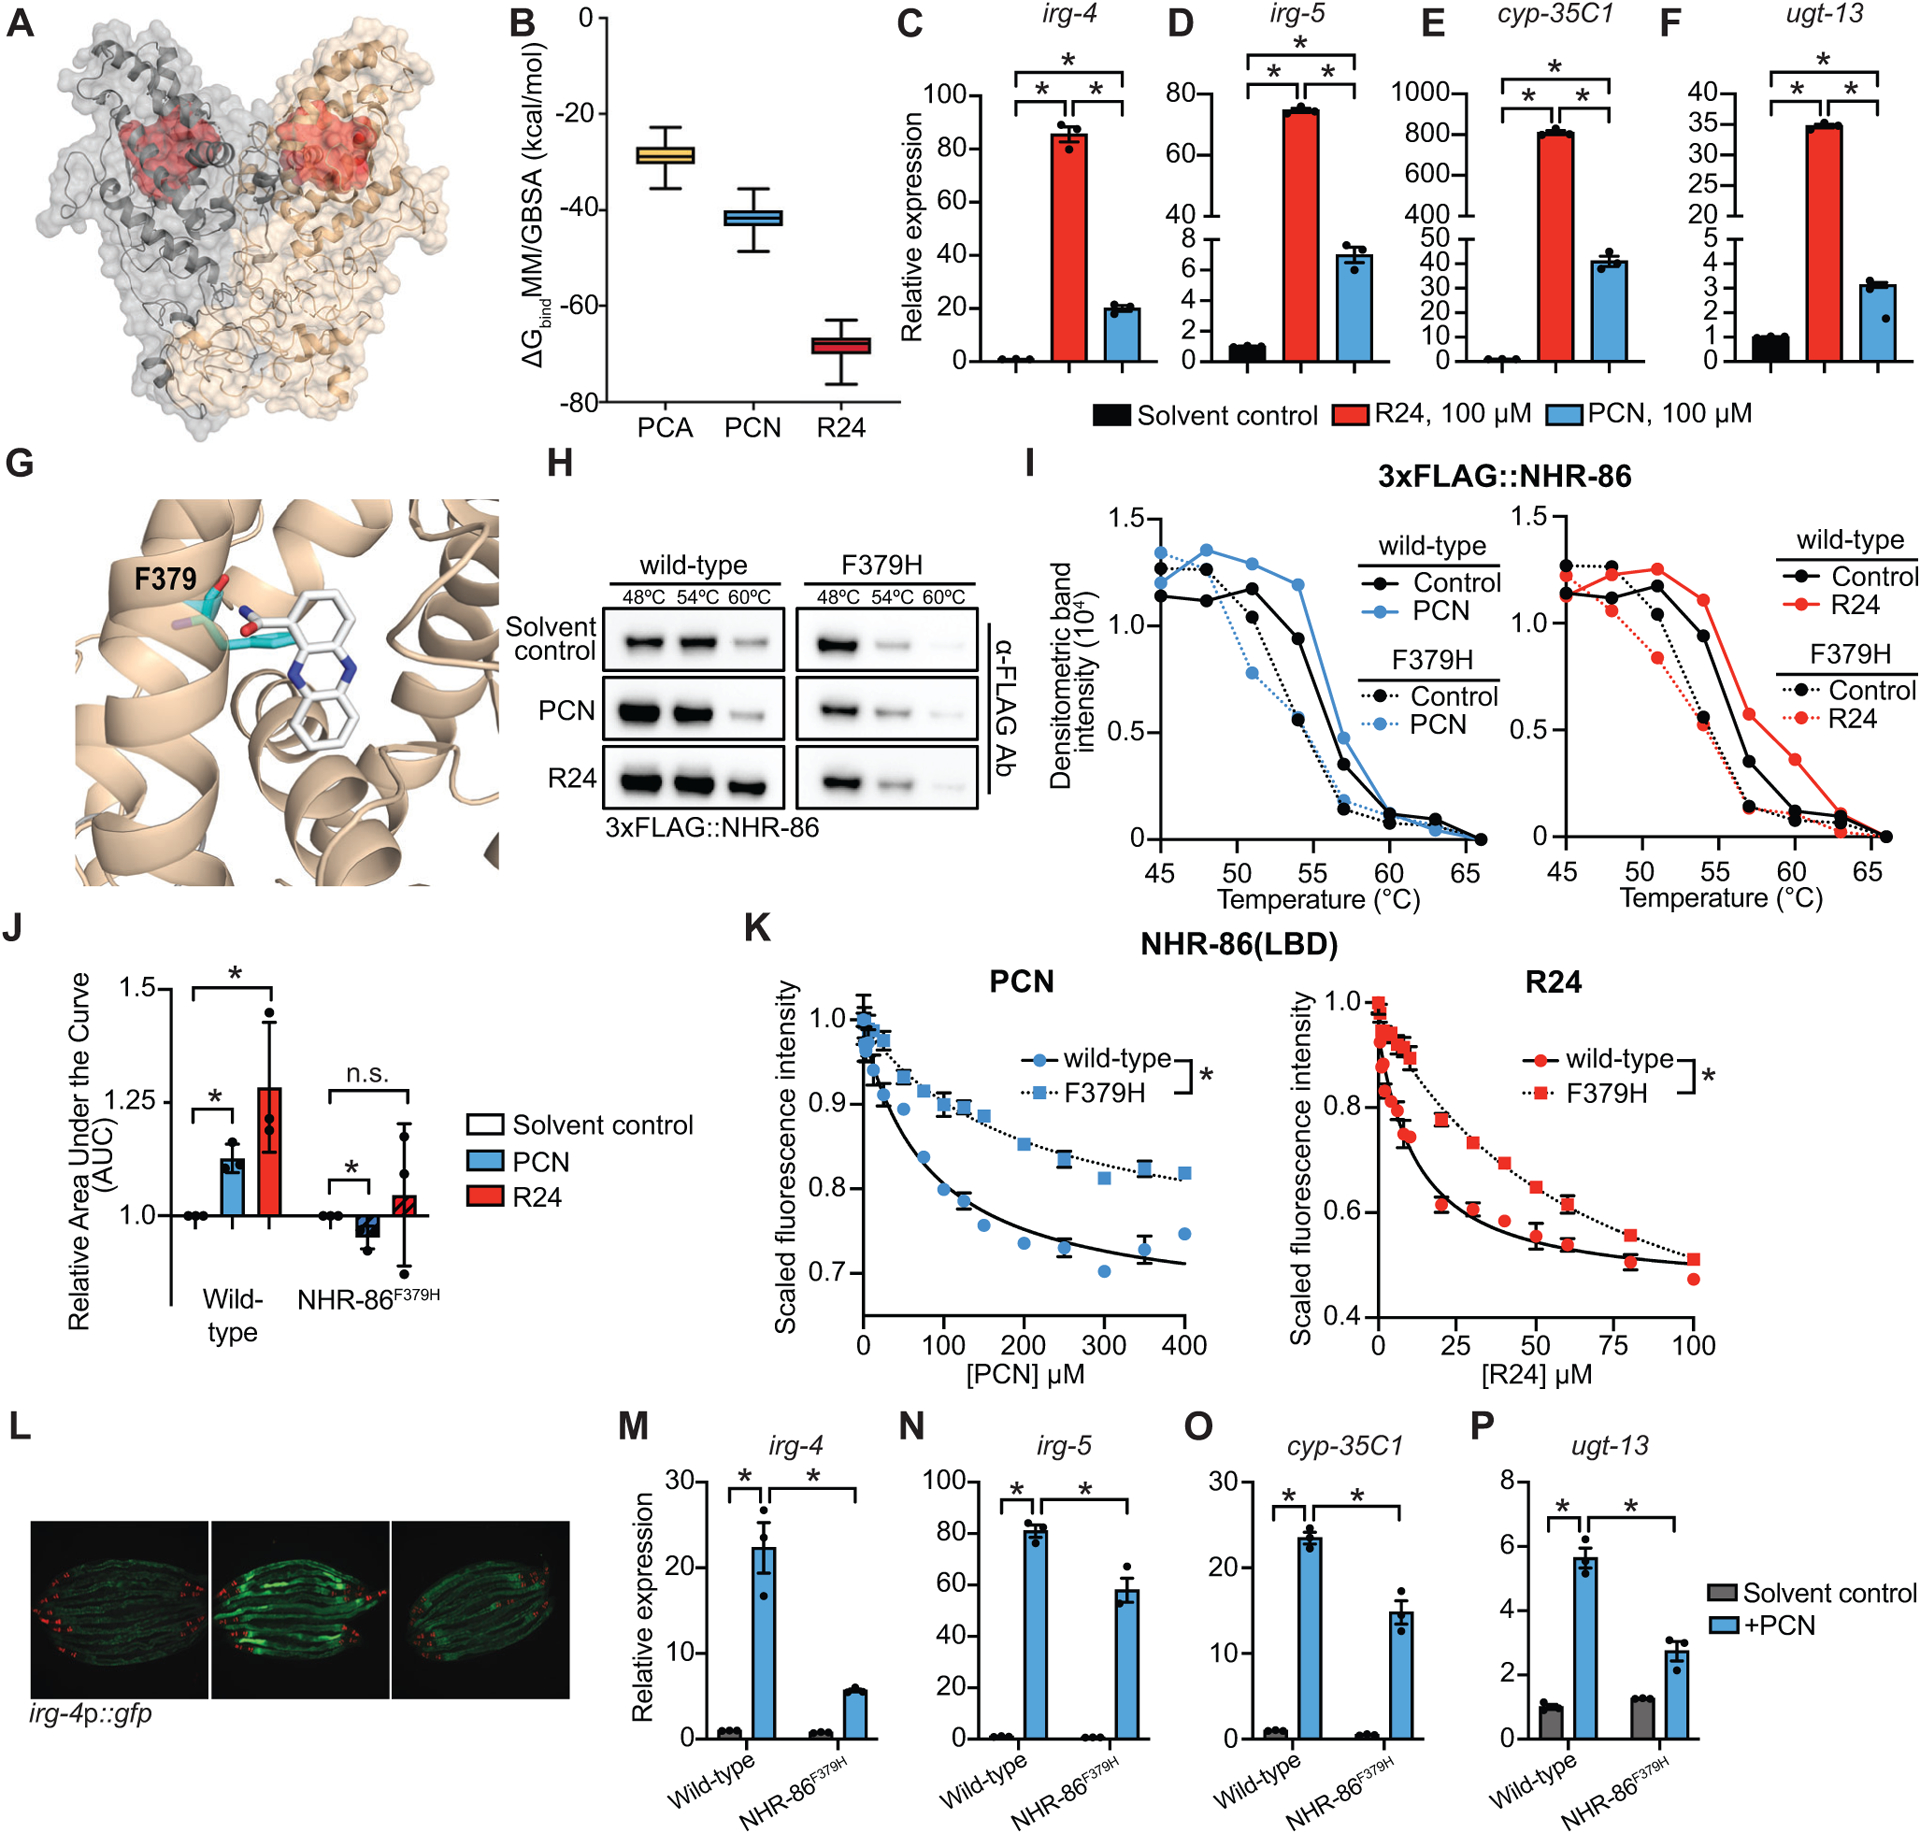
(A) In silico molecular modeling of full-length apo NHR-86 as a homodimer. The identified ligand-binding pocket is indicated in red. (B) Average free energy of ligand-binding for PCA, PCN, and R24 calculated using the molecular mechanics/generalized Born surface area (MM/GBSA). See also Supplemental Video S1. (C-F) qRT-PCR analysis of wild-type animals exposed to either solvent control (1% DMSO) or 100 μM R24 or 100 μM PCN. Data are the average of biological replicates (n=3) with error bars giving SEM. *equals p<0.05 (Brown-Forsythe and Welch ANOVA with Dunnett’s multiple comparisons test). (G) An in silico model of PCN bound to the identified binding pocket in the NHR-86(LBD). The interaction of phenylalanine 379 (F379) (cyan) and PCN (white) is shown. (H) A representative immunoblot of a CETSA experiment using an anti-FLAG antibody that probed whole cell lysates from C. elegans 3xFLAG∷NHR-86 and 3xFLAG∷NHR-86F379H strains treated with indicated conditions. (I) A representative densitometric quantification from a CETSA experiment that characterized the interaction of solvent control, PCN, and R24 with 3xFLAG∷NHR-86 and 3xFLAG∷NHR-86F379H (n=3) (J) The area under the curve was quantified from each biological replicate for the experiment described in (I) and normalized to the solvent control condition of 3xFLAG∷NHR-86 (n=3). All biological replicates for this experiment are shown in Fig. S4B. Data are the average of all biological replicates with error bars giving SEM. *equals p<0.05 (two-tailed, unpaired t-test with Welch’s correction). (K) Intrinsic tryptophan fluorescence intensity of the purified ligand-binding domain (LBD) of wild-type NHR-86 and NHR-86 containing the F379H mutation treated with the indicated concentrations of PCN and R24 each normalized to the solvent control-treated samples. Curves represent a non-linear regression fit of the scaled fluorescence intensity data points for each condition. Data are the average of biological replicate samples (n=3) with error bars giving SEM. *equals p<0.05 (unpaired t-test with Welch’s correction) for equilibrium dissociation constant (Kd) between the wild-type NHR-86(LBD) and the NHR-86F379H mutant protein. SDS-PAGE analysis of purified NHR(LBD)F379H is shown in Fig. S3A. (L) Images of indicated C. elegans irg-4p∷gfp animals grown on media that was supplemented with PCN (448 μM) or solvent control, as indicated, (scale bar, 200 μM). (M-P) qRT-PCR analysis of the indicated innate immune genes in wild-type and NHR-86F379H animals exposed to either solvent control or PCN (448 μM) in the absence of infection. Data are the mean of biological replicates (n=3) with error bars giving SEM. *equals p<0.05 (two-way ANOVA with Tukey’s multiple comparisons test). Source data for this figure is in Table S3. See also Fig. S4.