
Figure 6:
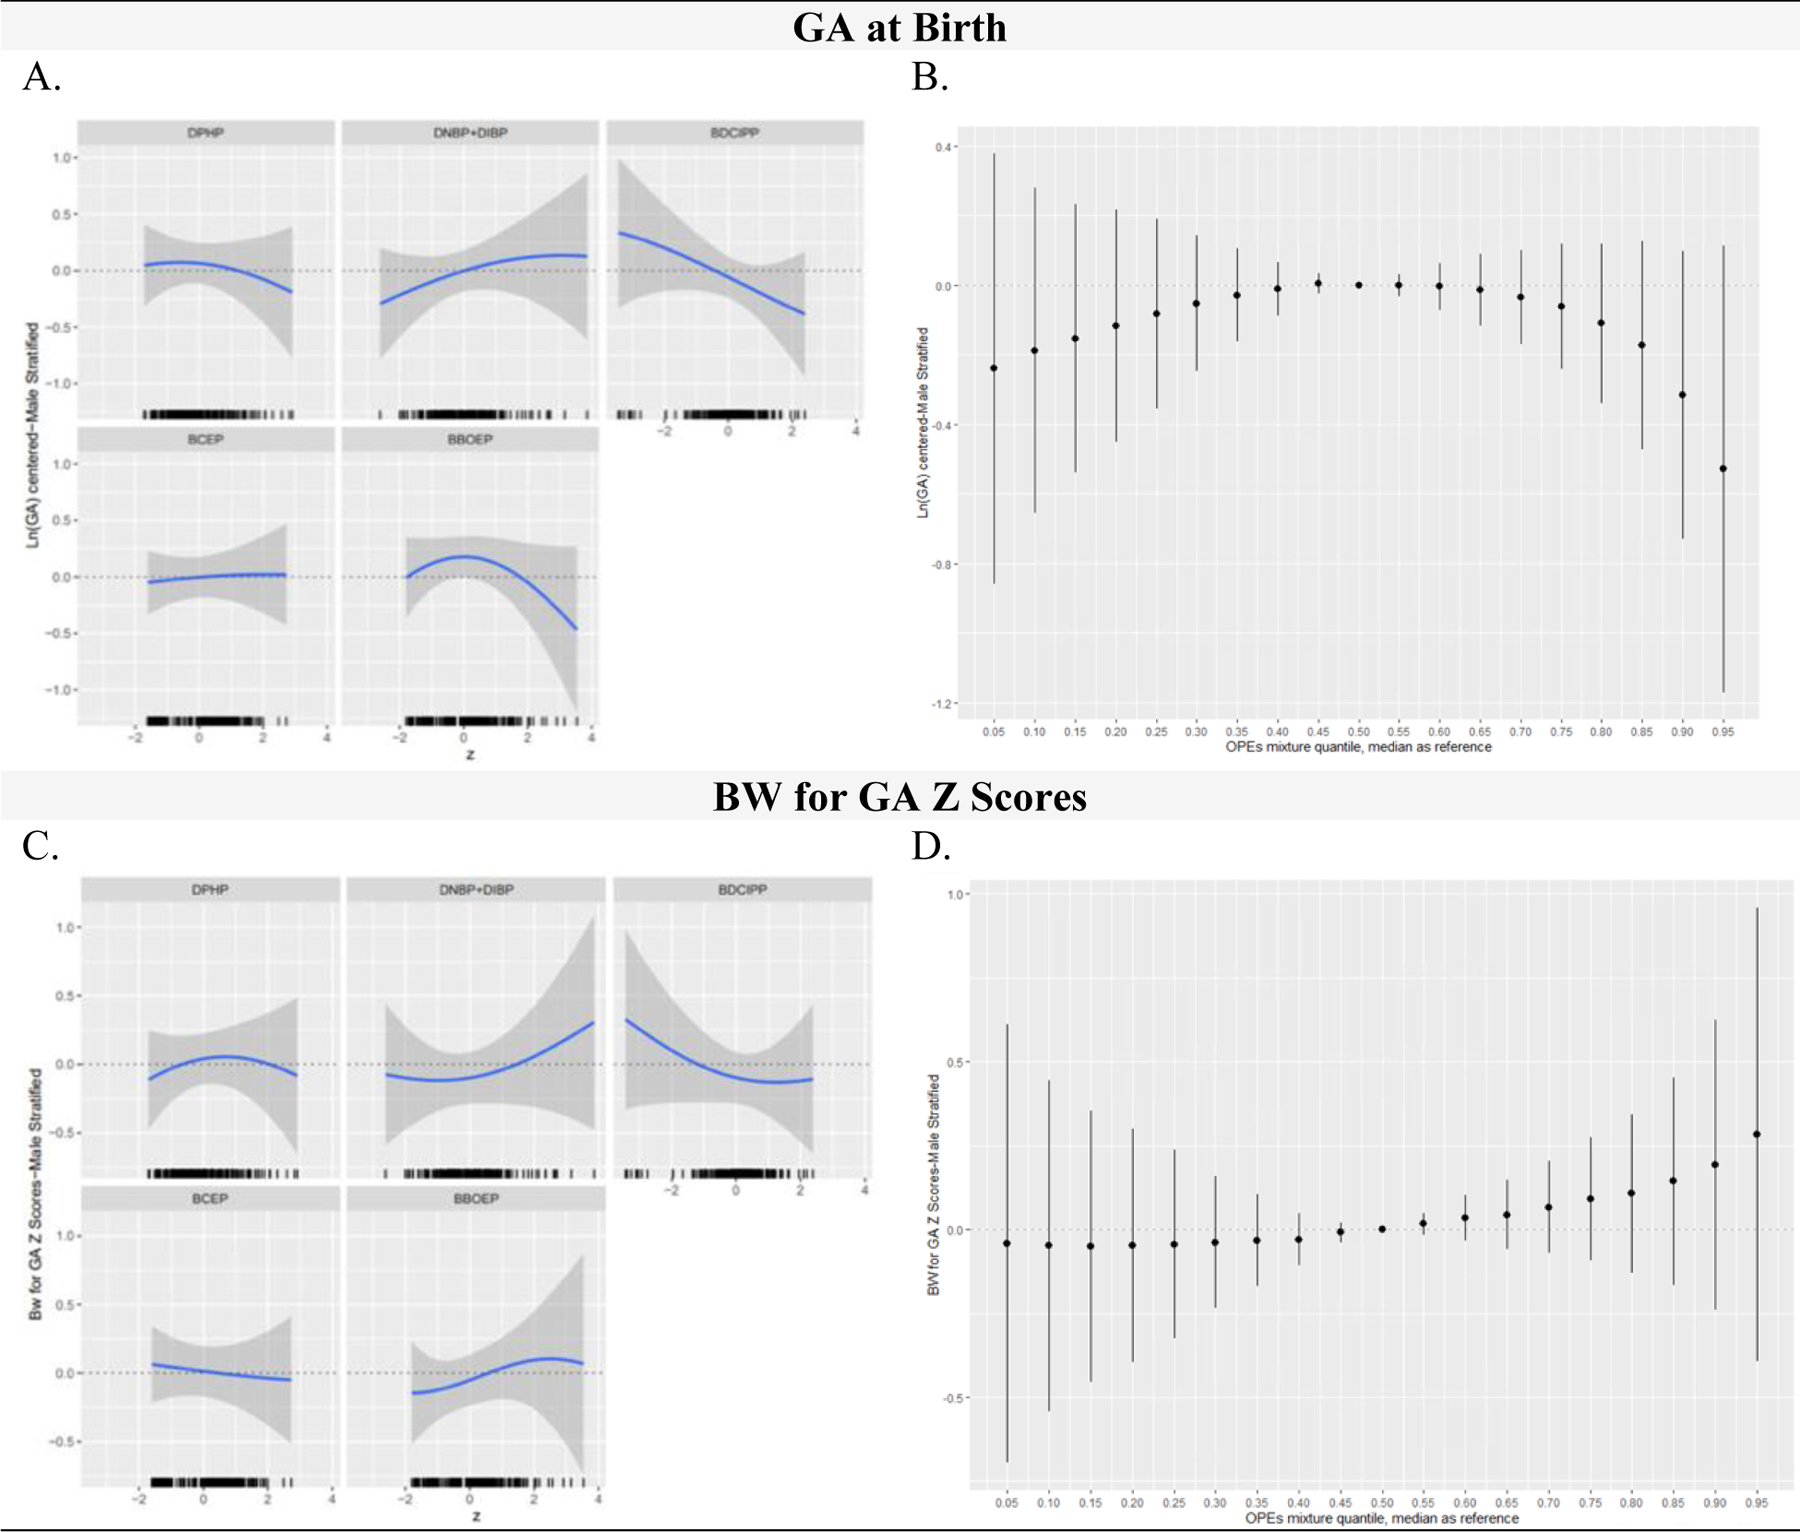
OPE Metabolite Mixtures (ng/mL) and Infant Gestational Age at Birth (weeks) and Birthweight for Gestational Age (BW for GA) Z Scores in Male Stratified Models, Using BKMR (N=206)
Figure 6 includes the univariate relationship between each metabolite and birth outcome, while other metabolites are fixed at the median, and a rug plot showing the distribution of the specified metabolite along the x-axis of each panel (column 1) and the cumulative metabolite mixture results showing the estimated difference in the birth outcome when setting all metabolites to the percentile specified on the x-axis compared with setting all metabolites to their median values (column 2). All GA at birth outcome models were adjusted for recruitment site, maternal age, season of sample collection, gestational age at sample collection, race/ethnicity, pre-pregnancy BMI, income, education, infant birth order, infant sex, and maternal hypertensive disorders of pregnancy. All BW for GA z score outcome models were adjusted for recruitment site, maternal age, season of sample collection, gestational age at sample collection, race/ethnicity, pre-pregnancy BMI, income, education, infant birth order, and maternal hypertensive disorders of pregnancy. OPE metabolites were natural log-transformed, mean centered, and standard deviation scaled. Continuous covariates were mean centered and standard deviation scaled. Note: BKMR, Bayesian Kernel Machine Regression; OPE, Organophosphate Ester; DPHP, Diphenyl phosphate; DNBP+DIBP, Sum of Dibutyl phosphate and Di-isobutyl phosphate; BDCIPP, Bis(1,3-dichloro-2-propyl) phosphate; BCEP, Bis(2- chloroethyl) phosphate; BBOEP, Bis(butoxethyl) phosphate.