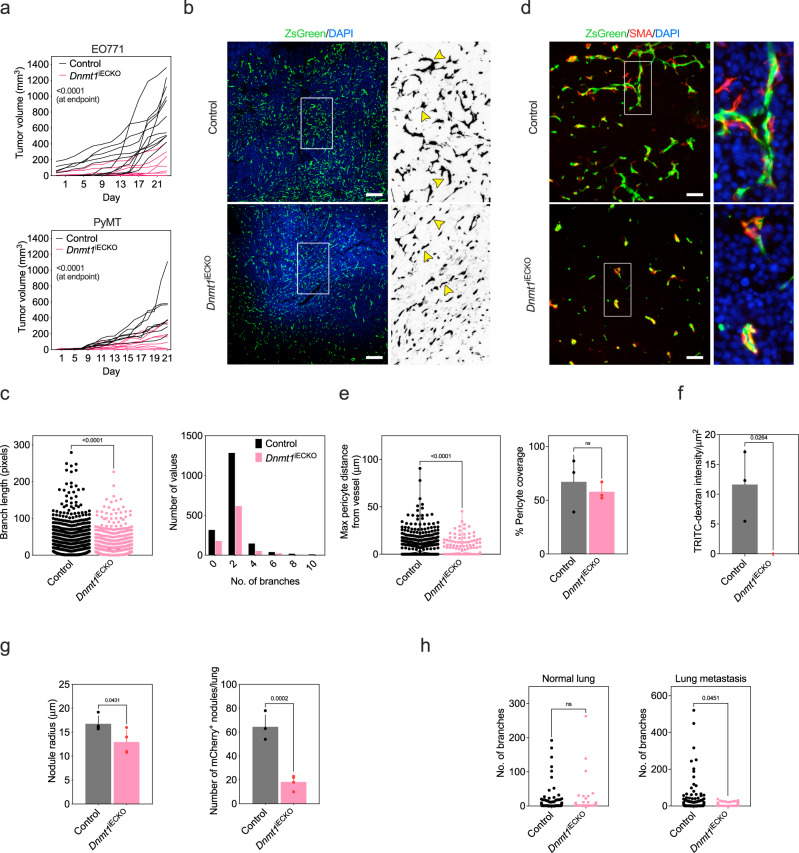
Fig. 1. Conditional deletion of Dnmt1 in ECs impairs tumor growth and reduces vascular density.
a EO771 (top) or PyMT (bottom) mammary tumors orthotopically engrafted in control versus Dnmt1iECKO mice. Tumor volumes were measured every other day with calipers (EO771; n = 11, control and n = 9, Dnmt1iECKO:PyMT; n = 8, control and n = 8, Dnmt1iECKO). For EO771, results were statistically significant beginning at day 15; for PyMT results were statistically significant beginning on day 16. Results were analyzed using ANOVA and Sidak’s multiple comparisons test. b ZsGreen+ tumor vasculature from the indicated mice. Boxed areas at right were zoomed 5× for detail and converted to an 8-bit binary image, and then inverted to reveal lateral branches/filopodia. Arrowheads point to either highly branched or straighter and narrower vessels in control versus Dnmt1iECKO mice, respectively. Scale bars = 100 μm. c Quantification of vessel branch length presented as a dot plot or histogram to show the distribution of branch lengths and numbers of branches (n = 3 individual tumors and nine histological sections per group). Results were analyzed using Student’s t test. d Identification of pericytes in tumors using αSMA. Boxed areas were zoomed 5× and are shown at far right for detail. Scale bars = 100 μm. e Quantification of pericyte:EC distance (left) and total pericyte coverage (right) for control versus Dnmt1iECKO mice (n = 3 individual tumors and nine histological sections per group). Results were analyzed using Student’s t test. f Extravascular TRITC-dextran quantified from cryosections using n = 3 mice per group. Results were analyzed using Student’s t test. g Tumor nodule radius (left) and total number of tumor nodules formed by mCherry+ EO771 cancer cells injected via the tail vein in the indicated mice (n = 4 mice per group). Results were analyzed using Student’s t test. h Number of vessel branches in areas of normal lung versus areas containing mCherry+ tumor nodules in the indicated mice (n = 3 individual tumors and nine histological sections per group). All Student’s t tests are unpaired and two-tailed. All data are presented as mean ± STD. Source data are provided as a Source Data file.

