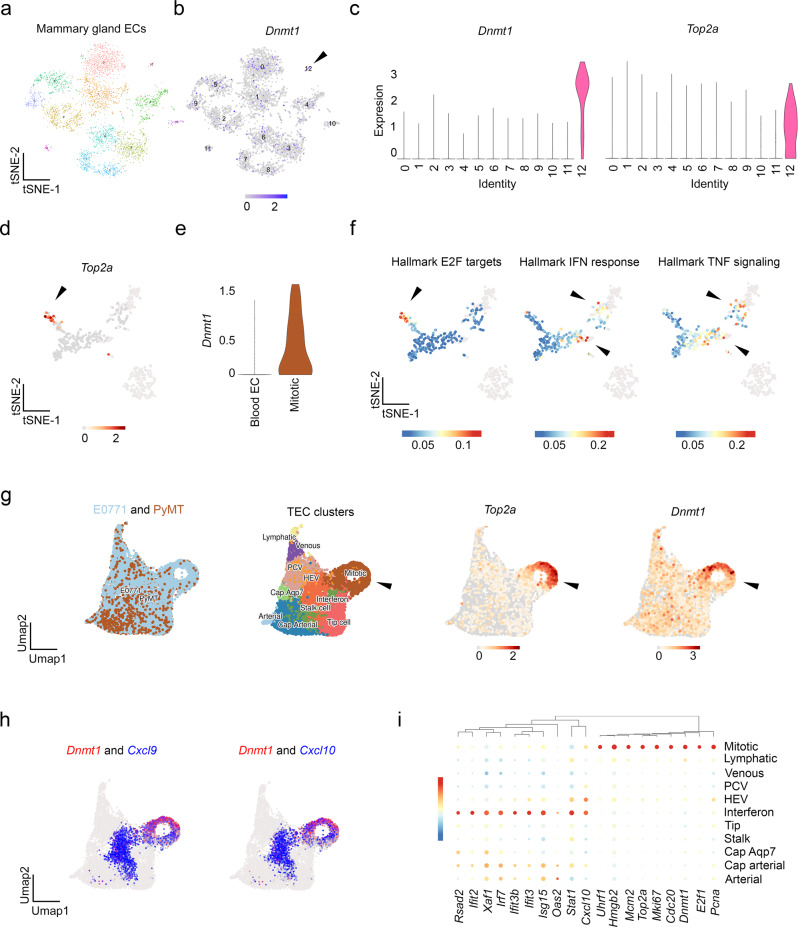
Fig. 5. ScRNA-sequencing reveals proliferative TECs that are diminished in IFN and TNF response genes.
a tSNE plot of normal mammary gland ECs isolated from pooled (n = 20) mammary glands. b tSNE plot showing Dnmt1 expression amongst the different clusters. The arrowhead points to cluster 12. c Violin plots showing enrichment of Dnmt1 and Top2a in cluster 12. d tSNE plot showing Top2a expression in PyMT TECs. e Dnmt1 expression in blood versus mitotic TECs from the PyMT model. f tSNEs depicting gene set enrichment scores for E2F targets (found in the mitotic cluster) and IFN or TNF response (found mainly in the non-mitotic clusters). g Clustering for E0771 and PyMT TECs including annotated clusters and Top2a or Dnmt1 expression. The arrowhead points to the mitotic cluster. h Co-expression of Dnmt1 and Cxcl9 or Cxcl10 in mitotic versus the IFN-like cluster. i Bubble plots for candidate IFN response genes and mitotic genes depicted by vessel subtype.

