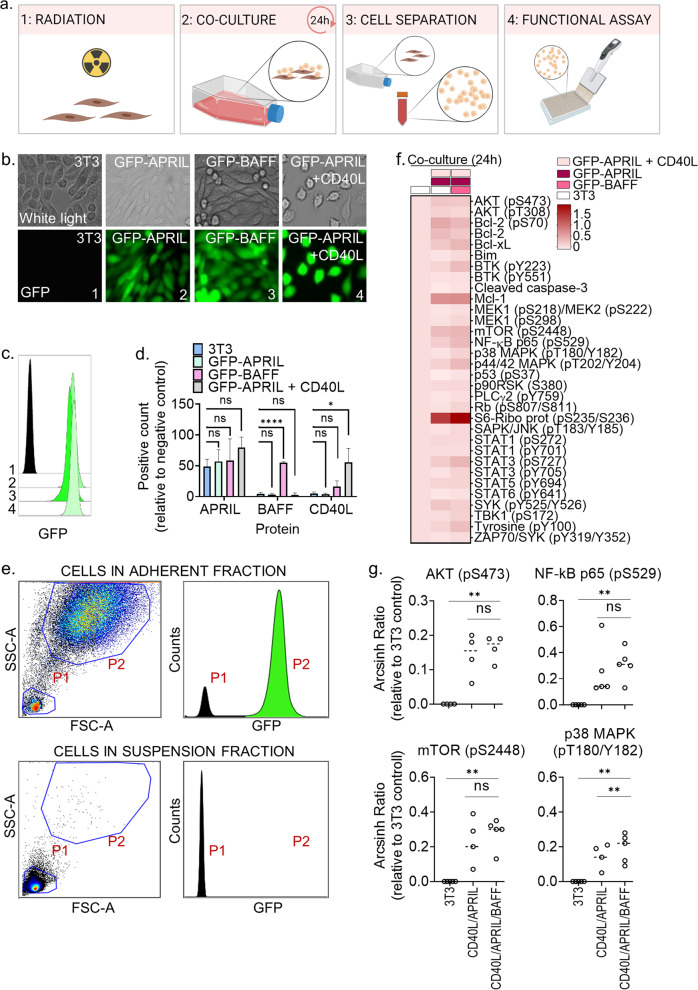
Fig. 1. Co-culture with CD40L/APRIL/BAFF expressing fibroblasts stimulates CLL signaling.
a Schematic illustration of the co-culture protocol. The figure was made with BioRender.com. b Fibroblasts were transduced with green fluorescent protein (GFP)-APRIL, GFP-BAFF or GFP-APRIL + CD40L. Expression of GFP was analyzed with an Axio Vert.A1 fluorescence microscope from Zeiss (Oberkochen, Germany; lower panels). The upper panels show the phase contrast. c Wild-type fibroblasts (1) and fibroblasts transduced with GFP-APRIL (2), GFP-BAFF (3) or GFP-APRIL + CD40L (4) were fixed and analyzed with a BD LSR Fortessa flow cytometer. The data were analyzed in Cytobank (https://cellmass.cytobank.org/cytobank/). The histogram shows relative GFP signal in the different cell lines. d Expression of APRIL, BAFF, and CD40L in wild-type fibroblasts (blue bars) and fibroblasts transduced with GFP-APRIL (green bars), GFP-BAFF (pink bars), or GFP-APRIL + CD40L (gray bars) were analyzed by flow cytometry. The cells were stained with the corresponding antibodies and gated for single cells. Signals are shown as percentage of positive cells relative to background signal from secondary antibody alone (mean ± standard deviation (SD), n = 2) Statistics were performed with a one-way ANOVA with multiple comparisons. *p < 0.05, ****p < 0.0001. e Peripheral blood mononuclear cells (PBMCs) from CLL patient samples were co-cultured at a 10:1 ratio with irradiated wild-type fibroblasts, GFP-APRIL and GFP-APRIL + CD40L fibroblasts (ratio 1:1:1) for 24 h. The CLL cells were then separated from the adherent fibroblast layer by carefully re-suspending and transferring the cell medium to a separate container. The remaining fibroblast layer was detached by trypsination. The two cell fractions were fixed separately and analyzed by flow cytomtery for detection of cell size, granularity, and GFP signals. The upper panels show signals in the adherent cell fraction, while the lower panels show signals in the soluble cell fraction. Size and granularity of the cells were determined by plotting side scatter (SSC-A) against forward scatter (FSC-A; left panels). The GFP signals in the gated populations (P1 and P2) are shown as counts (right panels). f Primary CLL cells were co-cultured with wild-type 3T3 fibroblasts only (left column), 3T3, GFP-APRIL, and GFP-APRIL + CD40L fibroblasts (middle column), or GFP-BAFF, GFP-APRIL, and GFP-APRIL + CD40L fibroblasts (right column) for 24 h. The cells were then fixed, permeabilized and stained with phospho-antibodies. The samples were analyzed with a BD LSR Fortessa flow cytometer. Signals are shown as median relative to the unstimulated wild-type control (first row) as arcsinh ratio. g The experiments were performed as described in f) on 4-5 CLL patient samples, including the patient sample shown in (f). **p < 0.01 calculated by a two-tailed paired t test comparing 3T3 fibroblasts (3T3) to GFP-APRIL + CD40L (CD40L/APRIL), and GFP-APRIL + CD40L (CD40L/APRIL) to GFP-BAFF and GFP-APRIL + CD40L (CD40L/APRIL/BAFF) assuming Gaussian distribution.

