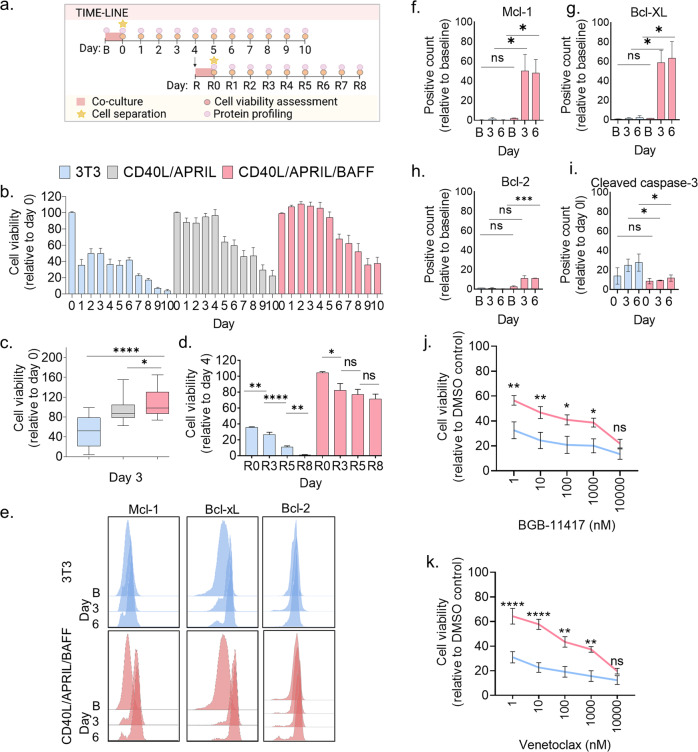
Fig. 2. Transient CD40L/APRIL/BAFF stimulation of primary CLL cells induces durable anti-apoptotic and drug resistance signals.
a Illustration of the protocol setup. Co-culture and separation of the CLL cells from the fibroblasts are indicated in the time-lines. A baseline (B) CLL sample was collected for protein profiling before the co-culture was started (upper time-line). The co-culture was performed for 24 h (pink square) before the CLL cells were separated from the fibroblast layer (star). The CLL cells were kept in culture and collected at days 0–10, as indicated. The cells were assessed both for protein profiling (light pink circles) and cell viability (dark pink circles). At day 4, part of the CLL cells were exposed to a 24 h restimulation (R) with fibroblasts (lower time-line). The CLL cells were then separated from the fibroblasts (star) and kept in culture. CLL samples were collected for protein profiling (light pink circles) and cell viability assessment (dark pink circles) at the indicated time-points R0–R8. The figure was made with BioRender.com. b Peripheral blood mononuclear cells (PBMCs) from CLL patient samples were co-cultured at a 10:1 ratio with irradiated wild-type 3T3 fibroblasts; 3T3, GFP-APRIL and GFP-APRIL + CD40L fibroblasts (ratio 1:1:1); or GFP-APRIL, GFP-BAFF and GFP-APRIL + CD40L fibroblasts (ratio 1:1:1) for 24 h. The CLL cells were then separated from the adherent fibroblast layer and transferred to 384-well plates (10,000 cells/25 µl). Cell viability was assessed with the CellTiter-Glo luminescent cell viability assay for 10 consecutive days. The signals were normalized to the signal at day 0 (mean ± standard error of the mean (SEM), n = 5). c The experiments are described in (b). The CellTiter-Glo signals detected at day 3 are shown in a box plot (min to max, n = 5). Statistics were performed with a two-tailed unpaired t test. *p < 0.05, ****p < 0.0001. d PBMCs from CLL patient samples were co-cultured with the indicated fibroblast cell lines for 24 h as described in (a). After cell separation, the PBMCs were kept in culture. On day 4, the PBMCs were exposed to the same co-culture (re-stimulation) for another 24 h. Cell viability was assessed with the CellTiter-Glo luminescent cell viability assay at the indicated days. The signals were normalized to the cell viability detected at day 4 in the original setup. (R0; mean ± standard error of the mean (SEM), n = 3). Statistics were performed with an unpaired t test assuming both populations have the same SEM. *p < 0.05, **p < 0.01, ****p < 0.0001. e PBMCs from the same CLL patient samples were either fixed at baseline (B) or after co-culture with the different fibroblast lines for 24 h as described in (a). The cells were then permeabilized and stained with the indicated antibodies. Signals were analyzed by flow cytometry. The histograms show one representative experiment of 3 experiments. f–i The experiments are described in (e). The first 3 bars show 3T3 fibroblast co-cultured CLL cells. The 3 bars to the right show CD40L/APRIL/BAFF co-cultured CLL cells. The CLL cells from (e) were analyzed as percent positive counts relative to the baseline (mean ± SEM, n = 3). The graphs show measurements for baseline (B) or day 0, and day 3 and day 6 after co-culture. Statistics were performed with a two-tailed unpaired t test. *p < 0.05. j, k. PBMCs from CLL patient samples were co-cultured with 3T3 fibroblasts (blue line) or CD40L/APRIL/BAFF fibroblasts (pink line) for 24 h as described in (a). The CLL cells were separated from the adherent fibroblast layer and treated with BGB-11417 (j) or venetoclax (k) (1–10,000 nM) for 72 h in a 384-well plate (10,000 cells/25 µl). Cell viability was assessed with the CellTiter-Glo luminescent cell viability assay. Signals were normalized to the negative (0.1% DMSO) control (mean ± SEM, n = 6). Statistics were performed with a two-tailed 2way ANOVA with Bonferroni corrections. *p < 0.05, **p < 0.01, ****p < 0.0001.

