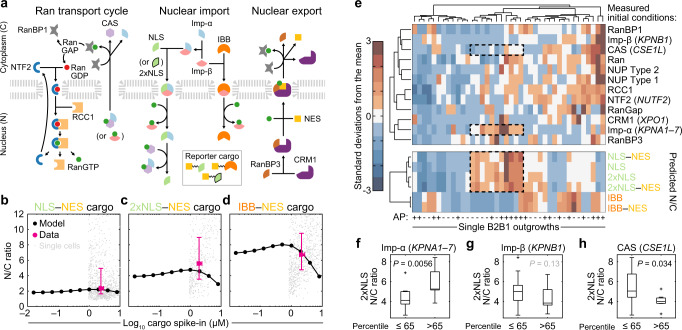
Fig. 4. ErbB heterodimerization triggers divergent nucleocytoplasmic transport.
a Overview of the nucleocytoplasmic transport model adapted from Riddick and Macara34,35. Arrows indicate the dominant direction of the reversible reaction. Reporter cargos were engineered to fuse a nuclear export sequence (NES) with sequences of simian virus 40 T antigen (NLS) or cap-binding protein 80 (2xNLS), which bind to Imp-α/β heterodimers with different affinity, or the Imp-β-binding domain of KPNA2 (IBB), which binds directly to Imp-β. See Supplementary Note 1. b–d Validated steady-state accumulation of induced NLS–NES (b), 2xNLS–NES (c), and IBB–NES (d) in the nucleus (N) relative to the cytoplasm (C). Steady-state N/C ratios were predicted for each reporter (black) and compared to population-level estimates of reporter abundance measured by quantitative immunoblotting66 and N/C ratios measured by immunofluorescence (magenta). Population-level data (magenta) are shown as the mean ± s.e. from n = 4 (b, c) or 3 (d) biological replicates on the x-axis and the median ± interquartile range from n = 1052 (b), 445 (c), or 861 (d) cells (gray; median-scaled along the x-axis to the population mean) collected from four biological replicates. e Outgrowth-specific predictions of steady-state N/C ratios. Transcriptome-wide profiles from each B2B1 3D outgrowth ±AP21967 (AP, upper) were used to scale initial conditions (see Methods) and simulate steady-state accumulation of 1 µM NLS, 2xNLS, or IBB import sequences ±NES (lower). Model initial conditions and steady-state N/C ratios were hierarchically clustered separately by row and together by column (Ward’s linkage, row standardization). Examples of high N/C states for NLS and 2xNLS are boxed alongside model species of interest. f–h Proportionately high expression of Imp-α and CAS, but not Imp-β, alters the steady-state accumulation of Imp-α/β-binding cargo. Predicted 2xNLS N/C ratio for n = 20 AP-treated B2B1 outgrowths split at the 65th percentile according to relative transcript abundance of KPNA1–7 (f), KPNB1 (g), or CSE1L (h). Boxplots show the median N/C ratio (horizontal line), interquartile range (box), 1.5x the interquartile range from the box edge (whiskers), and outliers (+). Differences between groups were assessed by one-sided rank sum test. Source data are provided as a Source Data file.

