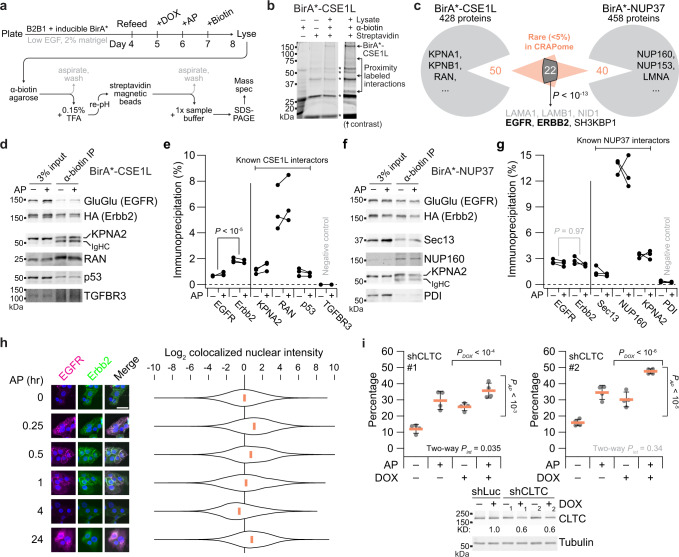
Fig. 5. CSE1L–NUP37 proximity labeling implicates a role for nucleocytoplasmic transport of EGFR–Erbb2.
a Overview experimental schema for proximity labeling with B2B1 cells. See Methods. b Two-step affinity purification of proximity-labeled extracts followed by SDS-PAGE. Non-specific bands from the terminal elution are indicated with asterisks. c Proximity-labeled proteins identified by mass spectrometry. Representative BioGRID interactors are listed along with notable shared targets based on their rarity in the CRAPome database41. Overlap significance was determined by one-sided hypergeometric test. Residual matrigel contaminants are listed in gray. d–g Replicated target validation for BirA*-CSE1L and BirA*-NUP37. Anti-biotin immunoprecipitates of proximity-labeled extracts from B2B1 cells expressing inducible FLAG-tagged BirA*-CSE1L (d) or BirA*-NUP37 (f) and treated ±0.5 µM AP for 24 h before biotinylation for 24 h were immunoblotted for the indicated targets and quantified from n = 3 paired biological replicates by densitometry (e, g). Differences in overall proximity labeling were assessed by two-way ANOVA with replication and AP treatment as a covariate. h Colocalized EGFR–Erbb2 puncta accumulate in the nucleus within 1 h and at 24 h after heterodimerization. B2B1 cells were plated on coverslips, treated with or without 0.5 µM AP for the indicated times, and immunostained for EGFR–GluGlu (magenta) and Erbb2–HA (green) with DAPI counterstain for nuclei (blue). Scale bar is 20 µm. Violin plots show the median and distribution of nuclear-masked, colocalized GluGlu–HA pixel intensities from n = 199 cells (99,206 pixels [0 min]), 205 cells (100,125 pixels [0.25 h]), 192 cells (90,474 pixels [0.5 h]), 186 cells (88,002 pixels [1 h]), 229 cells (107,010 pixels [4 h]), and 198 cells (92,486 pixels [24 h]). i Knockdown of clathrin-dependent endocytosis elevates the basal penetrance of the DE phenotype. B2B1 cells expressing inducible shCLTC were 3D cultured for 10 days with 0.5 µM AP added at Day 6 and/or 1 µg/ml DOX added at Day 5 where indicated. Data are shown as the arcsine transformed mean ± s.e. from n = 4 biological replicates where >150 outgrowths were scored per replicate. Differences by factor (DOX or AP) and two-factor interaction (int) were assessed by two-way ANOVA after arcsine transformation. Inducible knockdown was quantified relative to the paired no DOX control with tubulin used as a loading control. Source data are provided as a Source Data file.

