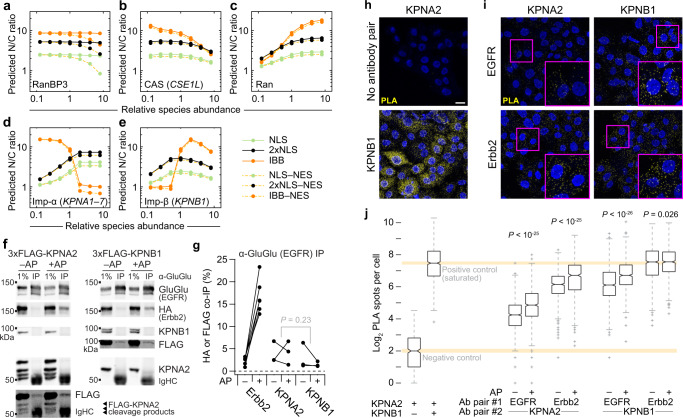
Fig. 6. EGFR and Erbb2 bind karyopherins of the classical nuclear-import family.
a–e Predicted sensitivity of the systems model to starting protein concentrations of RanBP3 (a), CAS (b), Ran (c), Imp-α (d), and Imp-β (e). Protein abundances are scaled relative to the concentrations used in the base model (Supplementary Data 4). Steady-state nuclear-to-cytoplasmic (N/C) ratios are shown for 1 µM of the representative cargo described in Fig. 4a. f, g, EGFR inducibly associates with Erbb2 and constitutively associates with KPNA2 and KPNB1. B2B1 cells expressing doxycycline (DOX)-inducible 3xFLAG-KPNA2 or 3xFLAG-KPNB1 were induced with 1 µg/ml DOX for 24 h and then treated with or without 0.5 µM AP for 1 h before lysis and GluGlu immunoprecipitation of the EGFR chimera. Samples were immunoblotted for the indicated targets (f) and quantified from n = 3 paired biological replicates by densitometry relative to the amount of immunoprecipitated EGFR chimera (g). Differences in overall KPNA2 and KPNB1 co-immunoprecipitation were assessed by two-way ANOVA with replication and AP treatment as a covariate. h, i ErbB interactions with karyopherins confirmed by proximity ligation assay (PLA). B2B1 cells were plated and stained with the indicated antibody combinations. Negative and positive controls (h) were KPNA2 alone and KPNA2:KPNB1 respectively. Experimental antibody pairings (i) combined EGFR and Erbb2 chimeras with KPNA2 or KPNB1 as indicated. Scale bar is 20 µm. j Quantification of PLA spots in control samples and B2B1 cells treated with or without 0.5 µM AP for 24 h and stained with the indicated antibody combinations. Boxplots show the median PLA spots per cell (horizontal line), interquartile range (box), estimated 95% confidence interval of the median (notches), 1.5x the interquartile range from the box edge (whiskers), and outliers (+) from n = 465 cells (negative control), 856 cells (positive control), or (left to right) 960, 855, 849, 641, 985, 847, 934, or 781 cells from 16 confocal image stacks across two coverslips per condition. Differences between groups were assessed by two-sided KS test with Bonferroni correction. Source data are provided as a Source Data file.

