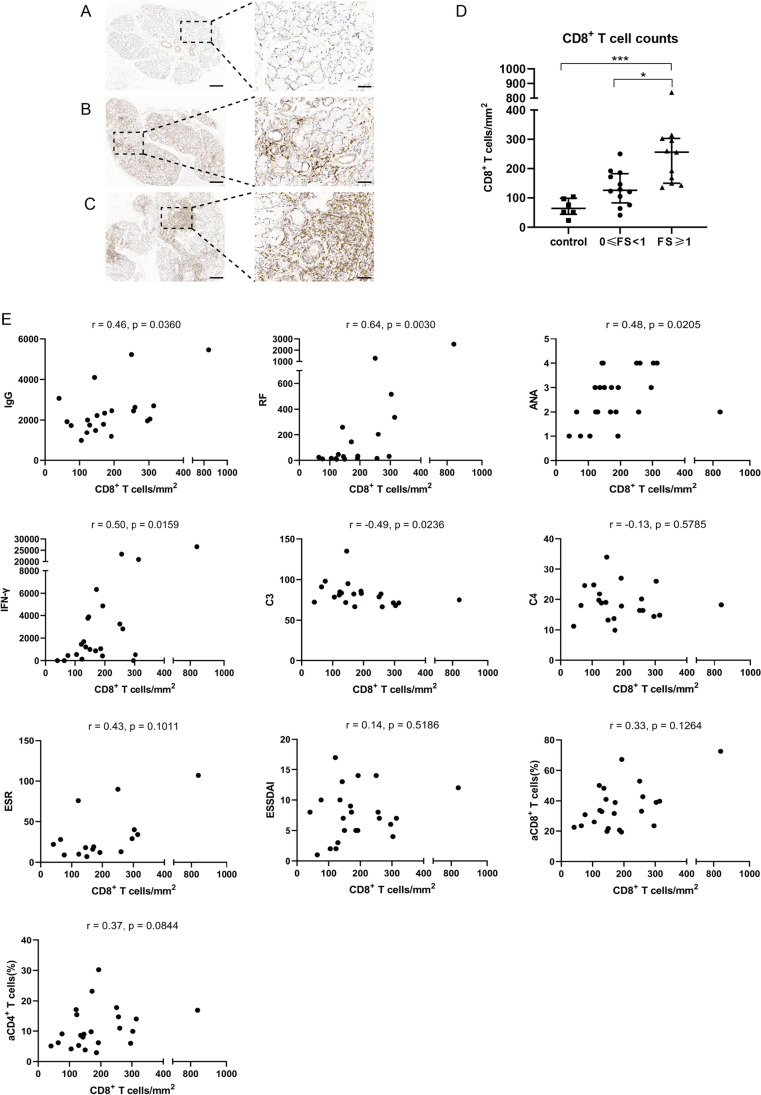
Fig. 4.
CD8+ T cell counts in LSG tissues and its correlations with disease parameters. A–C Representative images of three groups of patients: control patients (n = 6, A), pSS patients who were salivary gland 0≤ FS <1 (n = 12, B), and pSS patients who were salivary gland FS ≥1 (n = 11, C). D Comparations between the three groups. E Correlations of CD8+ T cell counts with disease parameters in pSS patients. Spearman correlation coefficients (r) and p values are indicated. CD8+ T cell counts had significant positive correlations with IgG, RF, ANA, and IFN-γ and had a negative correlation with complement C3. Left scale bars = 200 μm, right scale bars = 50 μm. Horizontal lines represent median and interquartile range, *p < 0.05, ***p < 0.001. IFN-γ: pg/mL; IgG: mg/dL; ESR: mm/h; RF: IU/mL; C3: mg/dL; C4: mg/dL. ANA titres graded at 4 levels (1:320, 1:1000, 1:3200, and 1:10000)

