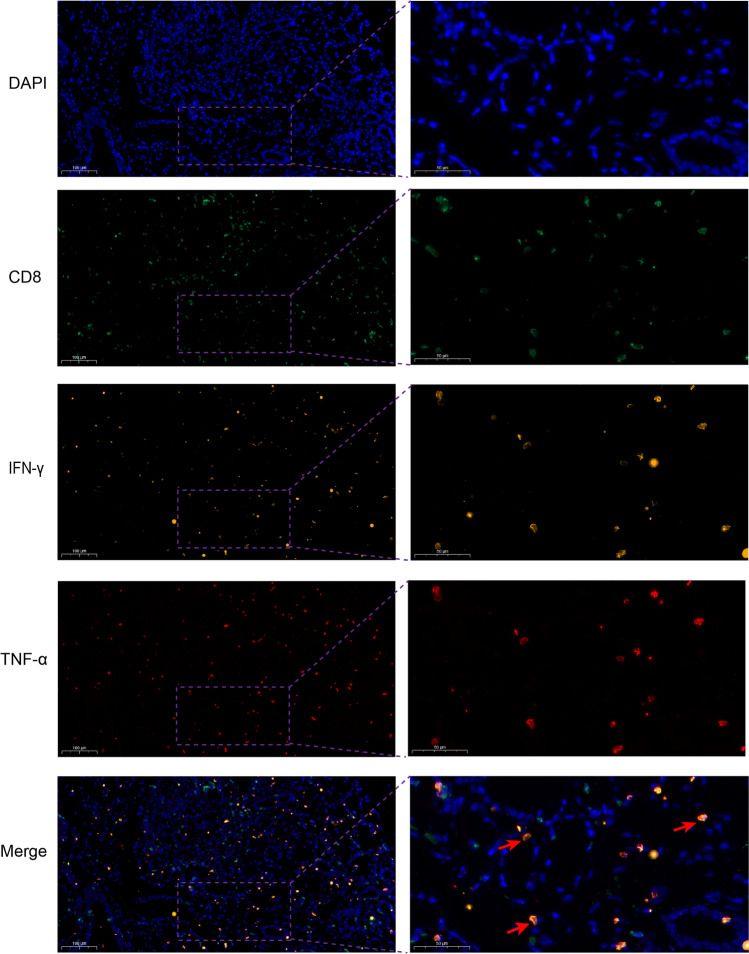
Fig. 5.
The expression of CD8, IFN-γ, and TNF-α in LSG tissues. The molecules of CD8 (green), IFN-γ (orange), and TNF-α (red) were detected by immunofluorescence in the paraffin-embedded sections of LSG tissue of a pSS patient with focus score 2.9, and DAPI was used to counterstain the nuclei. The red arrows show CD8+ T cells with positive IFN-γ and positive TNF-α in the Merge picture. Left scale bars = 100 μm, right scale bars = 50 μm

