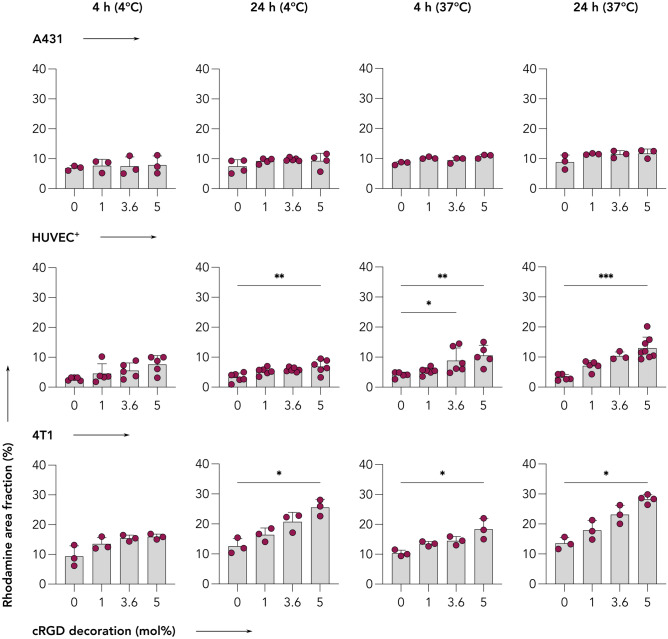
Fig. 3.
cRGD-decorated CCPM display time-, temperature-, and ligand density-dependent uptake in αvβ3 integrin-expressing cells. Quantification of the uptake (i.e., rhodamine area fraction %) of control and cRGD-decorated micelles from fluorescence microscopy images (raw images presented in Figs. 1, S2, S3, and S4) reveals that all four nanoparticle formulations are taken up to similar extent by A431 cells (αvβ3-integrinnegative cell line). Conversely, increasing the incubation time, incubation temperature, and cRGD density results in enhanced uptake by TNFα-activated HUVEC (HUVEC+) and 4T1 (αvβ3-integrin.positive) cells. Data are presented as mean ± standard deviation of n = 3–7 biological replicates. Level of significance was assessed by a Kruskal–Wallis one-way ANOVA test, followed by Dunn’s multiple comparison correction test. p-values: * < 0.05; ** < 0.01, and *** < 0.001

