Fig. 4.
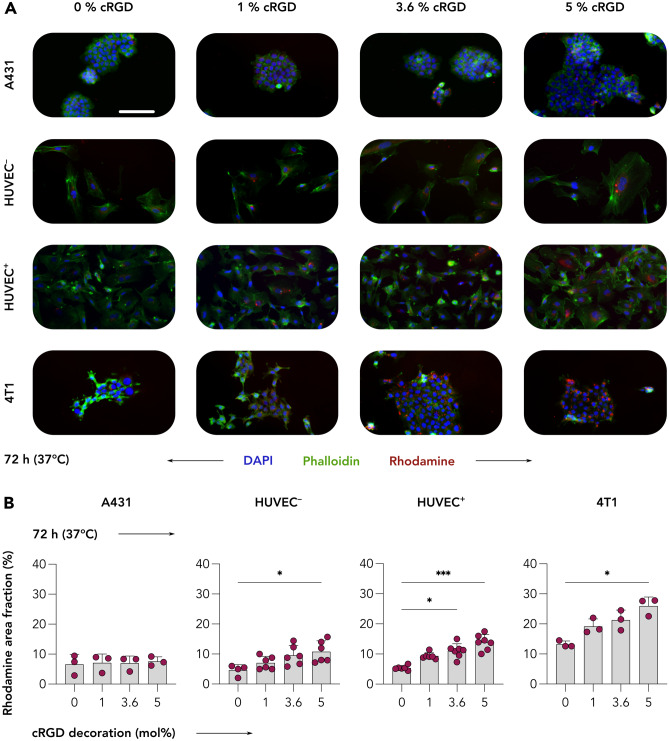
Uptake of control and cRGD-decorated CCPM by A431, HUVEC, and 4T1 cells after 72 h incubation. A Representative fluorescence microscopy images showing the uptake of control and cRGD-decorated micelles by A431, quiescent HUVEC (HUVEC−), TNFα-activated HUVEC (HUVEC+), and 4T1 cells at 72 h post incubation at 37 °C. Color coding: DAPI (nuclei, blue), phalloidin (actin filaments, green), and rhodamine (CCPM, red). Scale bar = 100 µm. B All four CCPM formulations are similarly taken up by A431 cells (αvβ3-integrinnegative), while increasing the cRGD-decoration density promotes uptake by HUVEC and 4T1 cells (i.e., all three αvβ3-integrin.positive cell lines). Importantly, TNFα-activated HUVEC display higher CCPM internalization in comparison to the non-activated cell line. Data are presented as mean ± SD. N = 3–7 biological replicates. Levels of significance were assessed by using a Kruskal–Wallis one-way ANOVA followed by Dunn’s multiple comparison correction test. *p < 0.05; **p < 0.01, and ***p < 0.001

