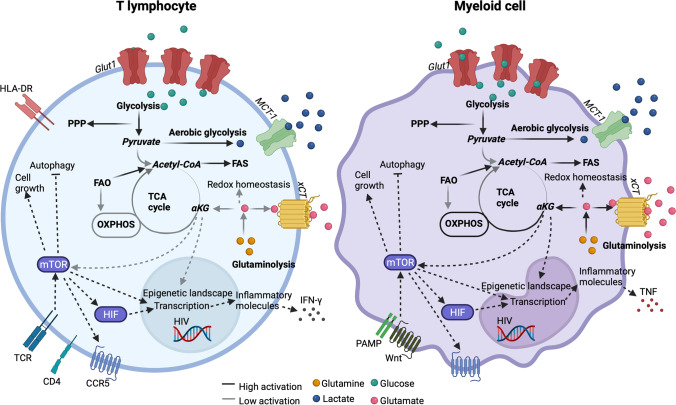
Fig. 1.
Proposed metabolic reprogramming of T cells and myeloid cells in PLWH on cART based on current literature. Black lines describe pathways with high activation, while grey lines describe pathways with low activation in the cells. This collectively gives an overview of the metabolic pathways on which the different cell types are less dependent. The metabolites glutamine, lactate, glucose, and glutamate are marked in orange, blue, green, and pink, respectively. Their relative intracellular/extracellular abundance is represented based on the localization of the metabolite in the figure. The figure was created using Biorender.com and adapted from Svensson Akusjärvi S: Immunometabolic reprogramming during suppressive HIV-1 infection. Doctoral Thesis, Karolinska Institute 2022 [86]

