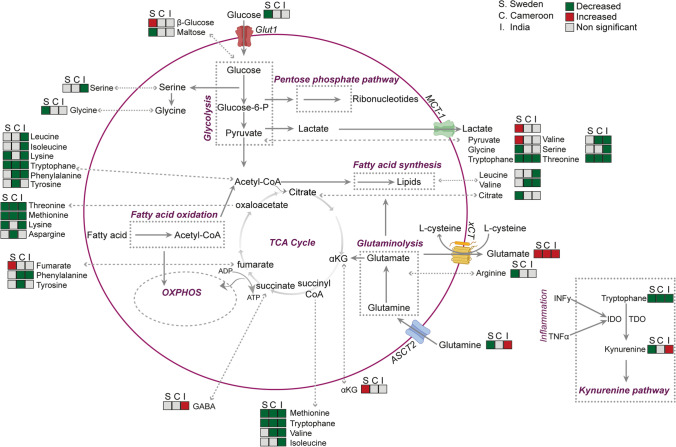
Fig. 2.
Alterations in metabolite levels in PLWH on cART compared to HC in cohorts from Cameroon (C), India (I), and Sweden (S) from targeted plasma metabolomics. Green boxes represent decreased metabolites in the PLWH on the cART group, while red boxes represent metabolites enriched at p < 0.05. Grey boxes represent metabolites that were not significantly different between the groups. The figure was adapted from Svensson Akusjärvi S: Immunometabolic reprogramming during suppressive HIV-1 infection. Doctoral Thesis, Karolinska Institute 2022 [86]

