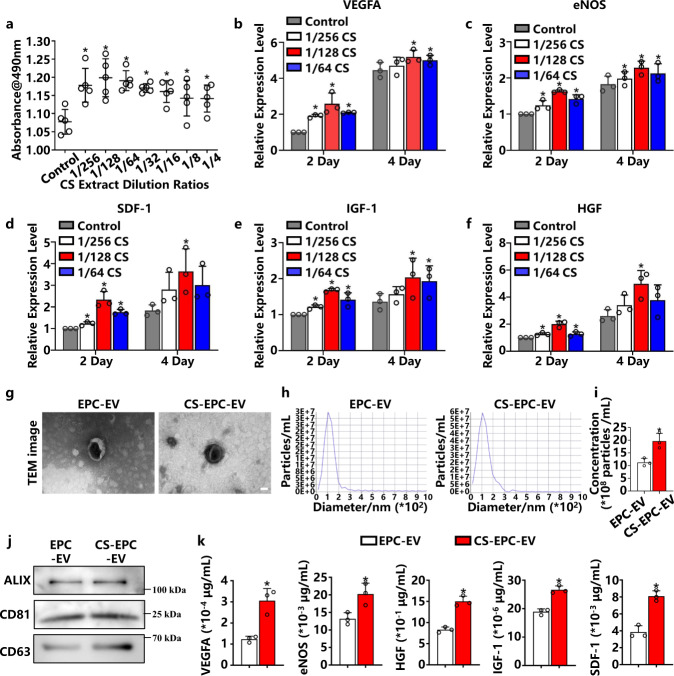
Fig. 2. Activation of EPCs to secrete highly bioactive EVs by silicate ions (CS-EPC-EV) or normal culture medium (EPC-EV).
a The effect of different concentrations of CS extracts on the proliferation of EPCs was tested by 3-(4,5-dimethylthiazol-2-yl)-5-(3-carboxymethoxyphenyl)-2-(4-sulfophenyl)−2H-tetrazolium (MTS) (n = 5, biological replicates per group) *p < 0.05 vs. the control. b–f The expression of proangiogenic genes was measured by quantitative reverse transcriptase Polymerase Chain Reaction (qRT‒PCR) on Day 2 and Day 4 in EPCs cultured in 1/256, 1/128, and 1/64 dilutions of (b Vascular endothelial growth factor A, VEGFA; c Endothelial nitric oxide synthase, eNOS; d Stromal cell-derived factor 1, SDF-1; e Insulin-like growth factor 1, IGF-1; f Hepatocyte growth factor, HGF) (n = 3, biological replicates per group). *p < 0.05 vs. the control. g Transmission electron microscopy (TEM) image of EPC-EVs, scale bar = 50 nm, (n = 3 independent experiment replicates per group). h Nanoparticle tracking analysis (NTA) analysis of CS-EPCs-EVs and EPC-EVs. i Particle concentrations of different types of EVs. *p < 0.05 vs. EPC-EVs (n = 3, independent experiment replicates per group). j Western blot analysis of the extracellular vesicle markers ALG-2-interacting protein X (Alix), Cluster of Differentiation 81 (CD81) and Cluster of Differentiation 63 (CD63). k ELISAs detected the content of VEGFA, eNOS, HGF, IGF-1, and SDF-1, in different EVs (n = 3, biological replicates per group). *p < 0.05 vs. EPC-EVs. Data are presented as the mean ± standard. Two-tailed Student’s t-test was used to compare the differences between two groups. One-way ANOVA and post hoc Bonferroni tests were used to compare differences among more than two groups. Source data are provided as a Source Data file. Each experiment was repeated 3 times or more independently with similar results.

