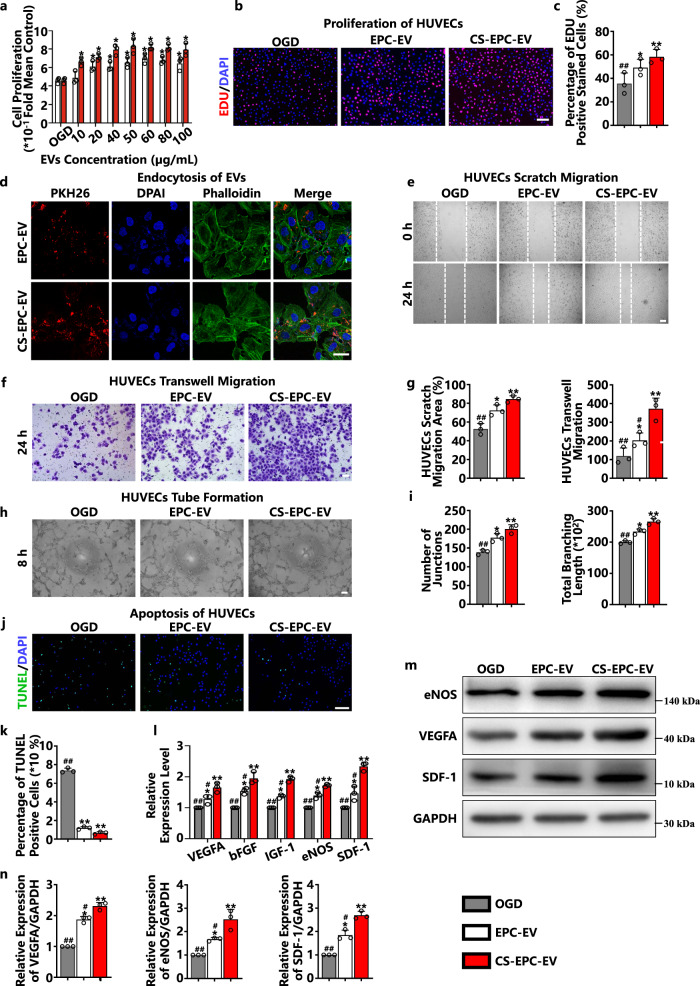
Fig. 3. CS-EPC-EVs can enhance the angiogenic ability of human umbilical vein endothelial cells (HUVECs) under glucose and oxygen deprivation.
a The proliferation of HUVECs treated with different EVs was detected by MTS under normal culture conditions (n = 3, biological replicates per group). b 5-ethynyl-2’-deoxyuridine (EdU) proliferation experiments of HUVECs treated with different EVs under glucose and oxygen deprivation (OGD). c Quantitative analysis of the EdU proliferation assay (n = 3, biological replicates per group). d PKH-26-labeled EVs (red fluorescence) were cocultured with HUVECs for 12 h, and phalloidin (green fluorescence) and 4′,6-diamidino-2-phenylindole (DAPI, blue fluorescence) were used to label the cytoskeleton and nucleus, respectively, (n = 3, biological replicates per group), scale bar = 25 μm. e, f Wound healing assays (e) (scale bar = 150 μm) and Transwell experiments (f) (scale bar = 100 μm) of HUVECs treated with different EVs under glucose and oxygen deprivation. g Quantitative analysis of the wound healing assay and Transwell assay (n = 3, biological replicates per group). h Tube formation experiments of HUVECs treated with different EVs under glucose and oxygen deprivation, scale bar = 150 μm. i Quantitative analysis of tube formation experiments (n = 3, biological replicates per group). j Terminal deoxynucleotidyl transferase dUTP nick end labeling (TUNEL) experiments of HUVECs treated with different EVs under glucose and oxygen deprivation, scale bar = 200 μm. k Quantitative analysis of the TUNEL assay. l qRT‒PCR detection of VEGFA, bFGF, IGF-1, eNOS, and SDF-1 gene expression in HUVECs treated with different EVs under glucose and oxygen deprivation (n = 3, biological replicates per group). m, n The expression and quantitative analysis of the VEGFA, eNOS, and SDF-1 proteins in HUVECs treated with different EVs under glucose and oxygen deprivation (n = 3, biological replicates per group). *p < 0.05, **p < 0.01 vs. OGD; #p < 0.05, ##p < 0.01 vs. CS-EPC-EVs. Data are presented as the mean ± standard. Two-tailed Student’s t-test was used to compare the differences between two groups. One-way ANOVA and post hoc Bonferroni tests were used to compare differences among more than two groups. Source data are provided as a Source Data file. Each experiment was repeated 3 times or more independently with similar results.

